
Page 315 - Applied Probability
P. 315
14. Poisson Approximation
304
n
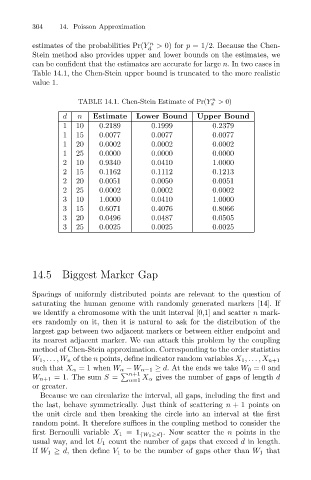
estimates of the probabilities Pr(Y
> 0) for p =1/2. Because the Chen-
d
Stein method also provides upper and lower bounds on the estimates, we
can be confident that the estimates are accurate for large n. In two cases in
Table 14.1, the Chen-Stein upper bound is truncated to the more realistic
value 1.
n
TABLE 14.1. Chen-Stein Estimate of Pr(Y d > 0)
d n Estimate Lower Bound Upper Bound
1 10 0.2189 0.1999 0.2379
1 15 0.0077 0.0077 0.0077
1 20 0.0002 0.0002 0.0002
1 25 0.0000 0.0000 0.0000
2 10 0.9340 0.0410 1.0000
2 15 0.1162 0.1112 0.1213
2 20 0.0051 0.0050 0.0051
2 25 0.0002 0.0002 0.0002
3 10 1.0000 0.0410 1.0000
3 15 0.6071 0.4076 0.8066
3 20 0.0496 0.0487 0.0505
3 25 0.0025 0.0025 0.0025
14.5 Biggest Marker Gap
Spacings of uniformly distributed points are relevant to the question of
saturating the human genome with randomly generated markers [14]. If
we identify a chromosome with the unit interval [0,1] and scatter n mark-
ers randomly on it, then it is natural to ask for the distribution of the
largest gap between two adjacent markers or between either endpoint and
its nearest adjacent marker. We can attack this problem by the coupling
method of Chen-Stein approximation. Corresponding to the order statistics
W 1 ,...,W n of the n points, define indicator random variables X 1 ,...,X n+1
such that X α = 1 when W α − W α−1 ≥ d. At the ends we take W 0 = 0 and
n+1
W n+1 = 1. The sum S = X α gives the number of gaps of length d
α=1
or greater.
Because we can circularize the interval, all gaps, including the first and
the last, behave symmetrically. Just think of scattering n + 1 points on
the unit circle and then breaking the circle into an interval at the first
random point. It therefore suffices in the coupling method to consider the
first Bernoulli variable X 1 =1 {W 1 ≥d} . Now scatter the n points in the
usual way, and let U 1 count the number of gaps that exceed d in length.
If W 1 ≥ d, then define V 1 to be the number of gaps other than W 1 that