
Page 253 - APPLIED PROCESS DESIGN FOR CHEMICAL AND PETROCHEMICAL PLANTS, Volume 1, 3rd Edition
P. 253
echanical Separations 225
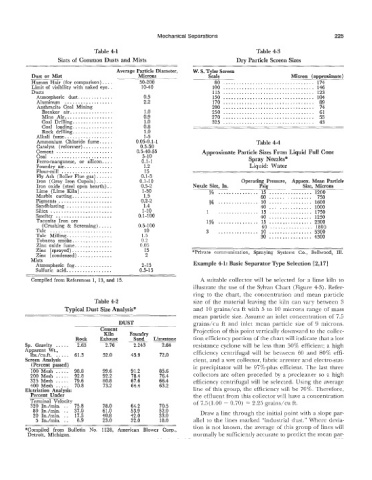
Table 4-1 Table 4-3
Sizes of C~mm~n Dusts and Mists Dry Particle Screen Sizes
Average Particle Diameter, W. S. Tyler Screen
Dust ox Mist Microns Scale Micron (approximate)
Human Hair (for comparison) .... 50-200 80 .................................. 174
Emit of visibility with naked eye. . 10-40 100 .................................. 146
Dusts 115 .................................. 123
Atmospheric dust.. ........... 0.5 150 .................................. 104
Aluminum .................. 2.2 170 .................................. a9
Anthracite Coal Mining 200 .................................. 74
Breaker air.. .............. 1 .O 250 .................................. 61
Mine Air. ................. 0.9 270 .................................. 53
Cod Drilling. .............. 1 .O 325 .................................. 43
Coal loading.. ............. 0.8
Rock drilling.. .............
1 .o
Alkali fume. ................. 1-5
Ammonium Chloride fume. .... 0.05-0.1-1 Table 44
Catalyst (reformer) ........... 0.5-50
Cement ..................... 0.5-40-55 Approximate Particle Sizes From Liquid
CoaI ....................... 5-10
Ferro-manganese, or siiicon. . . 0.1-1 Spray Nozzles*
Foundry air.. ................
~
Flour-mill ................... 1.2 Liquid: Water
15
Fly Ash (Boiler Flue gas) ...... 0.1-3
Iron (Gray Iron Cupola). ..... 0.1-10 Operating Pressure, Approx. Mean Particle
Iron oxide (steel open hearth). .
Lime (Lime Kiln) ............ 0.5-2 Nozzle Size, In. Psig Size, Microns
1-50
............... 15 ................ 1200
Marble cutting. .............. 1.5 60 ............... 750
Pigments .................... 0.2-2 3/q ............... 10 ................ 1600
Sandblasting ................ 1.4 40 ............... 1000
Silica ....................... 1-10 1 ............... 15 ................ 1750
Smelter ..................... 0.1-IO0 40 ................ 1250
Taconite Iron care 1% ............... 15 ................ 2300
(Crushing & Screening) .....
60 ................ 1800
Talc ....................... 0.5-100 3 ............... 10 ................ 5300
10
Talc Milling.. ............... 1.5 30 ................ 4300
Tobacco smoke.. ............. 02
Zinc oxide fume.. ............
Zinc (sprayed). .............. 0.05
15
Zinc (condensed). ............ 2 *Private communication, Spraying Systems Go., Bellwood, Ill.
Mists
Atmospheric fog.. ............ 2-15 Example 4-1: Basic Separator Type Selection 12,171
Sulfuric acid.. ............... 0.5-15
Compiled from References 1, 13, and 15. A suitable collector will be selected for a lime kiln to
illustrate the use of the Sylvan Chart (Figure 43). Refer-
ring to the chart, the concentration and mean particle
Table 4-2 size of the material leaving the kiln can vary between 3
Typical Dust Size Analysis* and 10 grains/cu ft with 5 to 10 microns range of mass
mean particle size. Assume an inlet concentration of 7.5
DUST grains/cu ft and inlet mean particle size of 9 microns.
Cement Projection of this point vertically downward to the collec-
Kiln Foundry
Rock
-- Exhaust Sand Limestone tion efficiency portion of the chart will indicate that a low
Sp. Gravity ..... 2.63 2.76 2.243 2.64 resistance cyclone will be less than 50% efficient; a high
Ap arent Wt., efficiency centrifugal will be between 60 and 80% effi-
I!s./cu.ft. . ~. 61.3 52.0 45.9 72.0
~
~
Screen Analysis cient, and a wet collector, fabric arrester and electro-stat-
(Percent nassed) ic precipitator ill be 97%-plus efficient. The last three
100 Mesh ..... 98.8 99.6 91.2 85.6
200 Mesh . . ~. . 92.8 92.2 78.4 76.4 collectors are often preceded by a precleaner so a high
325 Mesh . . ~. . 79.16 80.8 67.6 66.4 efficiency centrifugal will be selected. Using the average
400 Mesh ..*. . 70.8 73.2 64.4 63.2
Elutriaition Analysis: line of this group, the efficiency will be 70%. Therefore,
Percent Under the effluent from this collector \dl have a concentration
Terminal Velocitv of 7.5(1.00 - 0.70) = 2.25 grains/cu ft.
320 In./min. .. 75.8 78.0 64.2 70.5
80 Pn./min. .. 37.0 61.0 53.9 52.0 Draw a line through the initial point with a slope par-
20 In./min. .. 17.5 40.8 42.0 33.0
5 In./min. .. 8.9 23.0 32.0 18.0 allel to the lines marked “industrial dust.” Where devia-
tion is not known, the average of this group of lines will
+Compiled from Bulletin No. 1128, American Blower Corp.,
etroit, Michigan. normally be sufficiently accurate to predict the mean par-