
Page 53 - APPLIED PROCESS DESIGN FOR CHEMICAL AND PETROCHEMICAL PLANTS, Volume 1, 3rd Edition
P. 53
40 Applied Process Design for Chemical and Petrochemical Plants
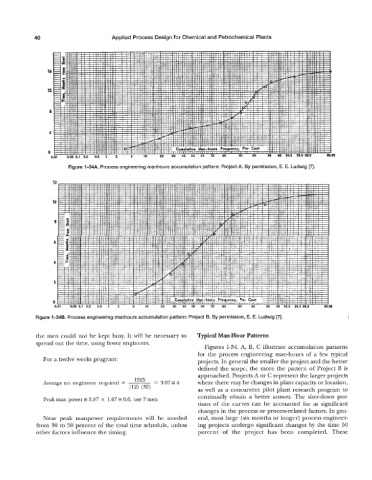
Figure 1 -34A. Process engineering manhours accumulation pattern: Project A. By permission, E. E. Ludwig [7].
Figure 1-346. Process engineering manhours accumulation pattern: Project B. By permission, E. E. Ludwig [7].
the men could not be kept busy. It will be necessary to Typical Man-Hour Patterns
spread out the time, using fewer engineers.
Figures 1-34, A, B, C illustrate accumulation patterns
for the process engineering man-hours of a few typical
For a twelve weeks program: projects. In general the smaller the project and the better
defined the scope, the more the pattern of Project B is
approached. Projects A or C represent the larger projects
Average no. engineers required = 15Z5 = 3.97a4 where there may be changes in plant capacity or location,
(12) (32) as well as a concurrent pilot plant research program to
continually obtain a better answer. The slow-down por-
Peak man power z 3.97 x 1.67 E 6.6, use 7 men
tions of the curves can be accounted for as significant
changes in the process or process-related factors. In gen-
Near peak manpower requirements will be needed eral, most large (six months or longer) process engineer-
from 30 to 50 percent of the total time schedule, unless ing projects undergo significant changes by the time 50
other factors influence the timing. percent of the project has been completed. These