Page 266 - Applied Statistics And Probability For Engineers
P. 266

c07.qxd  5/15/02  10:18  M  Page 224 RK UL 6 RK UL 6:Desktop Folder:TEMP WORK:MONTGOMERY:REVISES UPLO D CH114 FIN L:Quark Files:


               224     CHAPTER 7 POINT ESTIMATION OF PARAMETERS


                                    Sometimes there are several unbiased estimators of the sample population parameter. For
                                 example, suppose we take a random sample of size n   10  from a normal population and
                                 obtain the data x   12.8, x   9.4, x   8.7, x   11.6, x   13.1, x   9.8, x   14.1,
                                                        2
                                               1
                                                                                  5
                                                                                           6
                                                                                                   7
                                                                         4
                                                                3
                                 x 8   8.5, x 9   12.1, x 10   10.3. Now the sample mean is
                                            12.8   9.4   8.7   11.6   13.1   9.8   14.1   8.5   12.1   10.3
                                        x
                                                                       10
                                            11.04
                                 the sample median is
                                                               10.3   11.6
                                                            ~               10.95
                                                            x
                                                                    2
                                 and a 10% trimmed mean (obtained by discarding the smallest and largest 10% of the sample
                                 before averaging) is

                                                   8.7   9.4   9.8   10.3   11.6   12.1   12.8   13.1
                                              x tr1102
                                                                         8
                                                   10.98

                                 We can show that all of these are unbiased estimates of  . Since there is not a unique unbiased
                                 estimator, we cannot rely on the property of unbiasedness alone to select our estimator. We
                                 need a method to select among unbiased estimators. We suggest a method in Section 7-2.3.


               7-2.2  Proof That S is a Biased Estimator of   (CD Only)

               7-2.3 Variance of a Point Estimator

                                                   ˆ
                                            ˆ
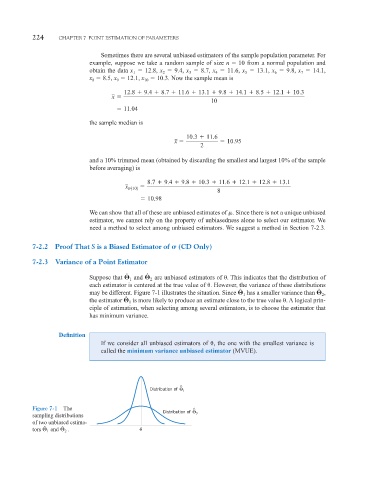
                                 Suppose that   1  and   2  are unbiased estimators of  . This indicates that the distribution of
                                 each estimator is centered at the true value of  . However, the variance of these distributions
                                                                                                         ˆ
                                                                                ˆ
                                 may be different. Figure 7-1 illustrates the situation. Since   1  has a smaller variance than   ,
                                                                                                          2
                                            ˆ
                                 the estimator   1  is more likely to produce an estimate close to the true value  . A logical prin-
                                 ciple of estimation, when selecting among several estimators, is to choose the estimator that
                                 has minimum variance.
                       Definition
                                    If we consider all unbiased estimators of  , the one with the smallest variance is
                                    called the minimum variance unbiased estimator (MVUE).


                                                             ^
                                                             Θ
                                                    Distribution of
                                                              1
               Figure 7-1  The                                   ^
                                                        Distribution of     Θ
               sampling distributions                             2
               of two unbiased estima-
                  ˆ     ˆ                        θ
               tors 	 1  and 	 2  .
   261   262   263   264   265   266   267   268   269   270   271