
Page 163 - Applied statistics and probability for engineers
P. 163
Section 4-9/Erlang and Gamma Distributions 141
1.0
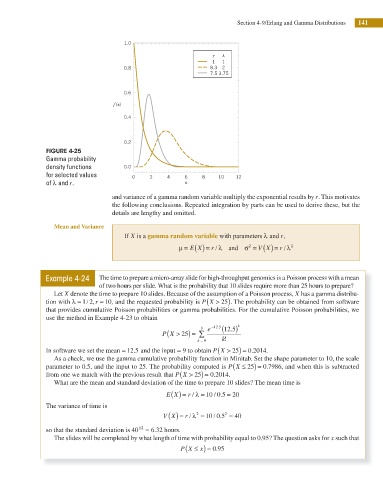
r l
1 1
0.8 8.3 2
7.5 3.75
0.6
f (x)
0.4
0.2
FIGURE 4-25
Gamma probability
density functions 0.0
for selected values 0 2 4 6 8 10 12
of λ and r. x
and variance of a gamma random variable multiply the exponential results by r. This motivates
the following conclusions. Repeated integration by parts can be used to derive these, but the
details are lengthy and omitted.
Mean and Variance
If X is a gamma random variable with parameters λ and r,
μ = ( ) = r / λ and σ = ( ) = r / λ 2
2
V
X
X
E
Example 4-24 The time to prepare a micro-array slide for high-throughput genomics is a Poisson process with a mean
of two hours per slide. What is the probability that 10 slides require more than 25 hours to prepare?
Let X denote the time to prepare 10 slides. Because of the assumption of a Poisson process, X has a gamma distribu-
(
/
tion with λ = 1 2,r = 10, and the requested probability is P X > 25). The probability can be obtained from software
that provides cumulative Poisson probabilities or gamma probabilities. For the cumulative Poisson probabilities, we
use the method in Example 4-23 to obtain
.
9
(
P X > 25) = ∑ e − 12 5 . ( 12 5) k
k = 0 k!
(
.
In software we set the mean = 12.5 and the input = 9 to obtain P X > 25) = 0 2014.
As a check, we use the gamma cumulative probability function in Minitab. Set the shape parameter to 10, the scale
(
parameter to 0.5, and the input to 25. The probability computed is P X ≤ ) = .7986, and when this is subtracted
0
25
(
from one we match with the previous result that P X > 25) = 0 2014.
.
What are the mean and standard deviation of the time to prepare 10 slides? The mean time is
E X ( ) = r λ = 10 0 . = 20
5
/
/
The variance of time is
/
/
V X ( ) = r λ = 10 0 .5 2 = 40
2
so that the standard deviation is 40 1/2 = 6.32 hours.
The slides will be completed by what length of time with probability equal to 0.95? The question asks for x such that
(
P X ≤ x) = .0 95