
Page 69 - Applied statistics and probability for engineers
P. 69
Section 2-5/Multiplication and Total Probability Rules 47
A A' E 1 E 2 E 3
B > E 1 E 4
B > A
B > E 2
B > A' B > E 3
B > E
B 4
2
3
4
1
FIGURE 2-15 Partitioning B = (B > E ) < (B > E ) < (B > E ) < (B > E )
an event into two mutually
exclusive subsets. FIGURE 2-16 Partitioning an event
into several mutually exclusive subsets.
Example 2-28 Semiconductor Failures Continuing with semiconductor manufacturing, assume the following
probabilities for product failure subject to levels of contamination in manufacturing:
Probability of Failure Level of Contamination
0.10 High
0.01 Medium
0.001 Low
In a particular production run, 20% of the chips are subjected to high levels of contamination, 30% to medium levels
of contamination, and 50% to low levels of contamination. What is the probability that a product using one of these
chips fails? Let
r H denote the event that a chip is exposed to high levels of contamination
r M denote the event that a chip is exposed to medium levels of contamination
r L denote the event that a chip is exposed to low levels of contamination
Then,
) ) P F L P L ( )
)
P F H P H ( ) + ( |
P F ( ) = ( | P F M P M ( ) + ( |
)
0
0 10
= . (0 20 0 01 .30) + .001 . (0 50 ) = .0 0235
. ) + . (0
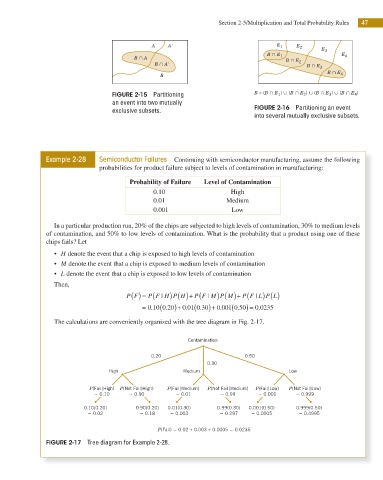
The calculations are conveniently organized with the tree diagram in Fig. 2-17.
Contamination
0.20 0.50
0.30
High Medium Low
P(FailuHigh) P(Not FailuHigh) P(FailuMedium) P(Not FailuMedium) P(FailuLow) P(Not FailuLow)
5 0.10 5 0.90 5 0.01 5 0.99 5 0.001 5 0.999
0.10(0.20) 0.90(0.20) 0.01(0.30) 0.99(0.30) 0.001(0.50) 0.999(0.50)
5 0.02 5 0.18 5 0.003 5 0.297 5 0.0005 5 0.4995
P(Fail) 5 0.02 + 0.003 + 0.0005 5 0.0235
FIGURE 2-17 Tree diagram for Example 2-28.