
Page 186 - Assurance of Sterility for Sensitive Combination Products and Materials
P. 186
168 Assurance of sterility for sensitive combination products and materials
Table 7.1 Key steps in the ISO 14971 risk management process.
Step Elements
1. Risk management plan • Establish risk evaluation and acceptability criteria
2. Risk analysis • Determine intended use of device
• Identify risks
• Estimate risk levels using risk evaluation criteria
3. Risk evaluation • Determine if risks meet acceptance criteria
4. Risk control • Implement controls where risks do not meet
acceptance criteria
• Determine if implementation of controls has
introduced new risks
risks not meeting the predetermined acceptance criteria are identified so
risk controls may be applied, Step 4. Step 4 also includes determination if
new risks may result from the use of new controls. This is a key process step
as changes to any process have the potential to trigger new risks. Note: see
ISO TS19930:2017 provides extensive discussion of factors related to pa-
tient risk from infections to consider, in the context of considering a change
in the terminal sterilization SAL.
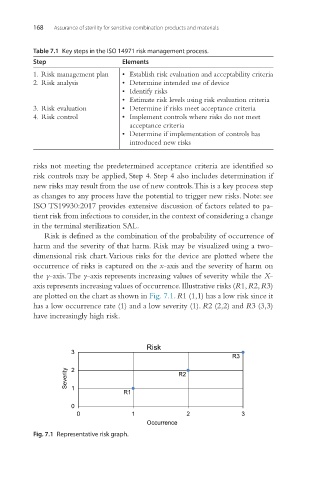
Risk is defined as the combination of the probability of occurrence of
harm and the severity of that harm. Risk may be visualized using a two-
dimensional risk chart. Various risks for the device are plotted where the
occurrence of risks is captured on the x-axis and the severity of harm on
the y-axis. The y-axis represents increasing values of severity while the X-
axis represents increasing values of occurrence. Illustrative risks (R1, R2, R3)
are plotted on the chart as shown in Fig. 7.1. R1 (1,1) has a low risk since it
has a low occurrence rate (1) and a low severity (1). R2 (2,2) and R3 (3,3)
have increasingly high risk.
Risk
3
R3
Severity 2 R2
1
R1
0
0 1 2 3
Occurrence
Fig. 7.1 Representative risk graph.