
Page 41 - Assurance of Sterility for Sensitive Combination Products and Materials
P. 41
Terminal sterilization 29
probability of a single microorganism occurring on an item after steriliza-
tion.” [1] It has been demonstrated that the SAL or viability or survival ver-
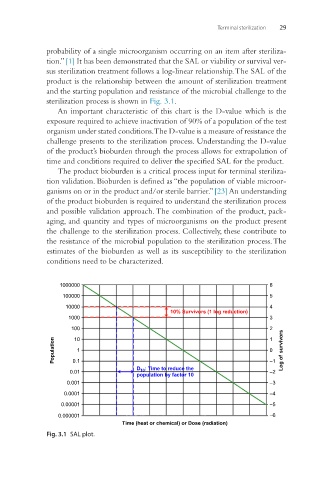
sus sterilization treatment follows a log-linear relationship. The SAL of the
product is the relationship between the amount of sterilization treatment
and the starting population and resistance of the microbial challenge to the
sterilization process is shown in Fig. 3.1.
An important characteristic of this chart is the D-value which is the
exposure required to achieve inactivation of 90% of a population of the test
organism under stated conditions. The D-value is a measure of resistance the
challenge presents to the sterilization process. Understanding the D-value
of the product’s bioburden through the process allows for extrapolation of
time and conditions required to deliver the specified SAL for the product.
The product bioburden is a critical process input for terminal steriliza-
tion validation. Bioburden is defined as “the population of viable microor-
ganisms on or in the product and/or sterile barrier.” [23] An understanding
of the product bioburden is required to understand the sterilization process
and possible validation approach. The combination of the product, pack-
aging, and quantity and types of microorganisms on the product present
the challenge to the sterilization process. Collectively, these contribute to
the resistance of the microbial population to the sterilization process. The
estimates of the bioburden as well as its susceptibility to the sterilization
conditions need to be characterized.
1000000 6
100000 5
10000 4
10% Survivors (1 log reduction)
1000 3
100 2 1
10
Population 1 0 Log of survivors
0.1
D 10 : Time to reduce the –1
0.01 –2
population by factor 10
0.001 –3
0.0001 –4
0.00001 –5
0.000001 –6
Time (heat or chemical) or Dose (radiation)
Fig. 3.1 SAL plot.