
Page 65 - Autonomous Mobile Robots
P. 65
48 Autonomous Mobile Robots
where A =[A T + a T (t)][A R + a R (t − τ)] is the signal amplitude along with
the noise affecting the amplitude. φ(t, τ) = φ(t) − φ(t − τ) is called the
differential phase noise which occurs due to the nonlinear frequency chirp from
imperfect VCO operation [19]. This phase noise affects the range accuracy
[20]. The amplitude and phase noise will affect the beat frequency signal in
two ways:
1. The amplitude noise will contain a signal frequency component
which is the same as the beat frequency. This noise component will
affect the amplitude of the beat frequency signal. This noise will
introduce uncertainty into the returned power.
2. The noise components with frequencies lying close to the beat fre-
quency (i.e., phase noise) distort the signal along the frequency axis.
This introduces noise into the beat frequency value and hence into the
range value. This will broaden the receiver power peaks and therefore
introduce noise into the range estimate.
2.4 RADAR RANGE SPECTRA INTERPRETATION
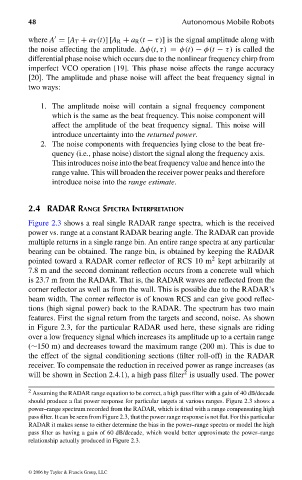
Figure 2.3 shows a real single RADAR range spectra, which is the received
power vs. range at a constant RADAR bearing angle. The RADAR can provide
multiple returns in a single range bin. An entire range spectra at any particular
bearing can be obtained. The range bin, is obtained by keeping the RADAR
2
pointed toward a RADAR corner reflector of RCS 10 m kept arbitrarily at
7.8 m and the second dominant reflection occurs from a concrete wall which
is 23.7 m from the RADAR. That is, the RADAR waves are reflected from the
corner reflector as well as from the wall. This is possible due to the RADAR’s
beam width. The corner reflector is of known RCS and can give good reflec-
tions (high signal power) back to the RADAR. The spectrum has two main
features. First the signal return from the targets and second, noise. As shown
in Figure 2.3, for the particular RADAR used here, these signals are riding
over a low frequency signal which increases its amplitude up to a certain range
(∼150 m) and decreases toward the maximum range (200 m). This is due to
the effect of the signal conditioning sections (filter roll-off) in the RADAR
receiver. To compensate the reduction in received power as range increases (as
will be shown in Section 2.4.1), a high pass filter 2 is usually used. The power
2
Assuming the RADAR range equation to be correct, a high pass filter with a gain of 40 dB/decade
should produce a flat power response for particular targets at various ranges. Figure 2.3 shows a
power–range spectrum recorded from the RADAR, which is fitted with a range compensating high
pass filter. It can be seen from Figure 2.3, that the power range response is not flat. For this particular
RADAR it makes sense to either determine the bias in the power–range spectra or model the high
pass filter as having a gain of 60 dB/decade, which would better approximate the power–range
relationship actually produced in Figure 2.3.
© 2006 by Taylor & Francis Group, LLC
FRANKL: “dk6033_c002” — 2006/3/31 — 17:29 — page 48 — #8