Page 204 - Basic Well Log Analysis for Geologist
P. 204

LOG  INTERPRETATION  CASE  STUDIES


                                SPONTANEOUS              CONDUCTIVITY  —  wittimmos  7m:   1000
                                                                              OHMS  M2/M
                                                                   CEEP   INDUCTION
                                   -  lel  +   MILLIVOLTS

                                                         RESISTIVITY  onms  m2/m
                                                           DEE?   INDUCTION


                                                         SPHERICALLY  FOCUSED  LOG
                                                               Ror


                                                                          oe
                                                                           a1  meas  temp  |  226  of  65°  F
                                                                7
                                                                                        °F
                                                                  7/8
                                                                           gl  meoe  temp
                                                                                     at
                                                        T  SIZE
                                                       ype  Fluid  in  hole  |  FGM
                                                                           Rec
                                                                                  Boor
                                                                              Temp
                                                         at  meos  temp  |  253  of  65°F

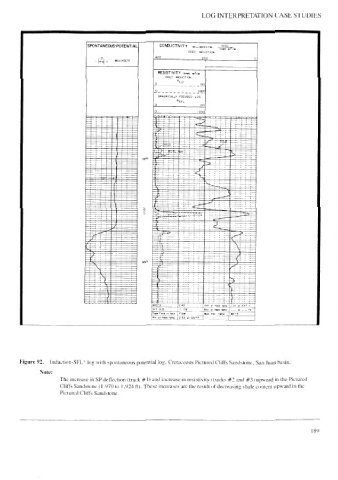
        Figure  92.   Induction-SFL*  log  with  spontancous  potential  log.  Cretaceous  Pictured  Cliffs  Sandstone,  San  Juan  basin.
               Note:
                      The  increase  in  SP  deflection  (track  #1)  and  increase  in  resistivity  (tracks  #2  and  #3)  upward  in  the  Pictured
                      Cliffs  Sandstone  (1.970  to  1.924  ft).  These  increases  are  the  result  of  decreasing  shale  content  upward  in  the
                      Pictured  Cliffs  Sandstone.


                                                                                                               189
   199   200   201   202   203   204   205   206   207   208   209