Page 212 - Basic Well Log Analysis for Geologist
P. 212

LOG  INTERPRETATION  CASE  STUDIES


                                                                     ILD  (OHMM)
                                                                    LLM  COHMM) |
                                                                     SFL  (OHMM)


                                                                         |  Ret  al  meas  temp
                                                                                   70  ot  74°F
                                                       DEPTH
                                                              a
                                                       :
                                                                          I  Ee
                                                       git  Size
                                                                                     or  __  oo  F
                                                                         _  Amc  at  meas  tomo
                                                       i.
                                                                         Max  Rec  Tamp
                                                                                  222°F
                                                       Typa  fluid  in  hola
                                                                |  Chemica
                                                                          ~
                                                                         L
                                                                               a
                                                                 93  of  74°F

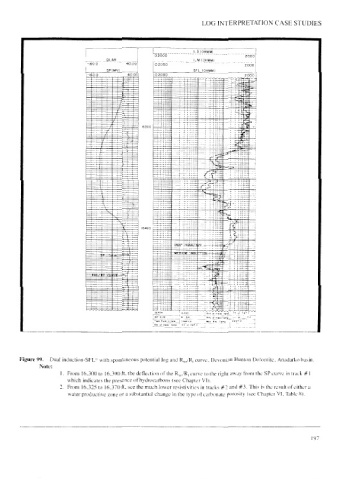
        Figure  99.   Dual  induction-SFL*  with  spontaneous  potential  log  and  R,,/R,  curve,  Devonian  Hunton  Delomite,  Anadarko  basin.
               Note:
                      1.  From  16,300  to  16,390  ft,  the  deflection  of  the  R,,,/R,  curve  to  the  right  away  from  the  SP  curve  in  track  #1
                         which  indicates  the  presence  of  hydrocarbons  (see  Chapter  VD.
                      2.  From  16.325  to  16.370  ft,  see  the  much  lower  resistivities  in  tracks  #2  and  #3.  This  is  the  result  of  either  a
                         water  productive  zone  or  a  substantial  change  in  the  type  of  carbonate  porosity  (see  Chapter  V1,  Table  8).


                                                                                                              197
   207   208   209   210   211   212   213   214   215   216   217