
Page 26 - Basic Well Log Analysis for Geologist
P. 26
BASIC RELATIONSHIPS OF WELL LOG INTERPRETATION
TT
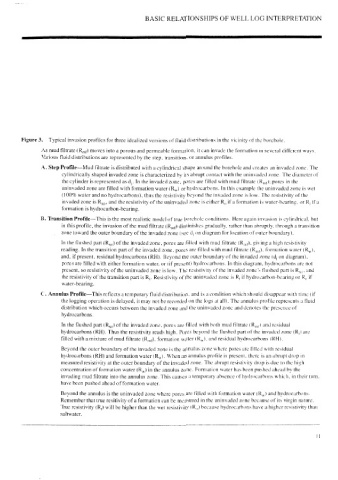
Figure 3. Typical invasion profiles for three idealized versions of fluid distributions in the vicinity of the borchole.
As mud filtrate (Rp) Moves into a porous and permeable formation, it can invade the formation in several different ways.
Various fluid distributions are represented by the step, transition, or annulus profiles.
A. Step Profile—Mud filtrate is distributed with a cylindrical shape around the borehole and creates an invaded zone. The
cylindrically shaped invaded zone is characterized by its abrupt contact with the uninvaded zone. The diameter of
the cylinder is represented as dj. In the invaded zone, pores are filled with mud filtrate (R,,¢); pores in the
uninvaded zone are filled with formation water (R,,) or hydrocarbons. In this example the uninvaded zone is wet
(100% water and no hydrocarbons), thus the resistivity beyond the invaded zone is low. The resistivity of the
invaded zone is R,,, and the resistivity of the uninvaded zone is either R, if a formation is water-bearing, or R, ifa
formation is hydrocarbon-bearing.
B. Transition Profile—This is the most realistic model of true borehole conditions. Here again invasion is cylindrical. but
in this profile, the invasion of the mud filtrate (R,,-) diminishes gradually, rather than abruptly, through a transition
zone toward the outer boundary of the invaded zone (see d; on diagram for location of outer boundary).
In the flushed part (R,,) of the invaded zone, pores are filled with mud filtrate (Rp), giving a high resistivity
reading. In the transition part of the invaded zone, pores are filled with mud filtrate (R,,;). formation water (Ry),
and, if present, residual hydrocarbons (RH). Beyond the outer boundary of the invaded zone (d; on diagram),
pores are filled with either formation water, or (if present) hydrocarbons. In this diagrani, hydrocarbons are not
present, so resistivity of the uninvaded zone is low. The resistivity of the invaded zone’s flushed part is R,,. and
the resistivity of the transition part is Rj. Resistivity of the uninvaded zone is R, if hydrocarbon-bearing or R, if
water-bearing.
C. Annulus Profile—This reflects a temporary fluid distribution, and is a condition which should disappear with time (if
the logging operation is delayed, it may not be recorded on the logs at all). The annulus profile represents a fluid
distribution which occurs between the invaded zone and the uninvaded zone and denotes the presence of
hydrocarbons.
In the flushed part (R,,) of the invaded zone, pores are filled with both mud filtrate (R,,-) and residual
hydrocarbons (RH). Thus the resistivity reads high. Pores beyond the flushed part of the invaded zone (Rj) are
filled with a mixture of mud filtrate (Rm»p), formation water (R,.), and residual hydrocarbons (RH).
Beyond the outer boundary of the invaded zone is the annulus zone where pores are filled with residual
hydrocarbons (RH) and formation water (R,,). When an annulus profile is present. there 1s an abrupt drop in
measured resistivity at the outer boundary of the invaded zone. The abrupt resistivity drop is due to the high
concentration of formation water (Ry) in the annulus zone. Formation water has been pushed ahead by the
invading mud filtrate into the annulus zone. This causes a temporary absence of hydrocarbons which, in their turn,
have been pushed ahead of formation water.
Beyond the annulus is the uninvaded zone where pores are filled with formation water (R,,) and hydrocarbons.
Remember that true resitivity of a formation can be measured in the uninvaded zone because of its virgin nature.
True resistivity (R,) will be higher than the wet resistivity (R,) because hydrocarbons have a higher resistivity than
saltwater.