
Page 52 - Basic Well Log Analysis for Geologist
P. 52
THE SPONTANEOUS POTENTIAL LO G
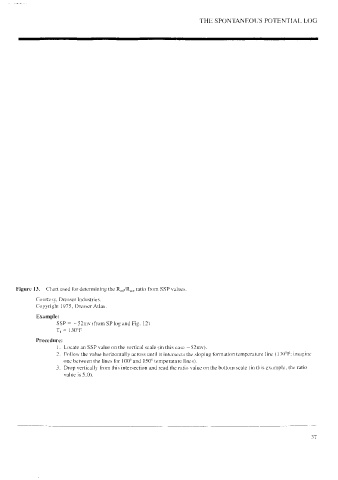
Figure 13. Chart used for determining the R,,pR,,. ratio from SSP values.
Courtesy, Dresser Industries.
Copyright 1975, Dresser Atlas.
Example:
SSP = ~—52mv (from SP log and Fig. [2)
T, = 130°F
Procedure:
|. Locate an SSP value on the vertical scale (in this case —S2mv).
2. Follow the value horizontally across until it intersects the sloping formation temperature line (1 30°F; imagine
one between the lines for 100° and 150° temperature lines).
3. Drop vertically from this intersection and read the ratio value on the bottom scale (in this example, the ratio
value 1s 5.0).
37