
Page 82 - Basic Well Log Analysis for Geologist
P. 82
POROSITY LOGS
sonic derived porosity will be too high. Hilchie (1978) Pra = Matrix density (see Table 7)
suggests the following empirical corrections for Pb il formation bulk density
hydrocarbon effect: Pr il fluid density (1.1 salt mud, 1.0 fresh mud, and
0.7 gas)
g = Psonic x 0.7 (gas)
@ = Psonic x 0.9 (oil)
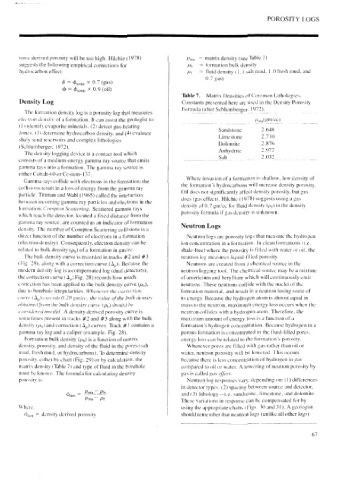
Table 7. Matrix Densities of Common Lithologies.
Density Log Constants presented here arc used in the Density Porosity
Formula (after Schlumberger, 1972).
The formation density log is a porosity log that measures
electron density of a formation. It can assist the geologist to:
Pinal Zm/ec)
(1) identify evaporite minerals, (2) detect gas-bearing
Sandstone 2.648
zones, (3) determine hydrocarbon density, and (4) evaluate
Limestone 2.710
shaly sand reservoirs and complex lithologies
Dolomite 2.876
(Schlumberger, 1972).
Anhydrite 2.977
The density logging device is a contact tool which
_ Salt 2.032.
consists of a medium-energy gamma ray source that emits
gamina rays into a formation. The gamma ray source is
either Cobalt-00 or Cesium-137.
Where invasion of a formation Is shallow, low density of
Gamma rays collide with electrons in the formation: the
the formatton’s hydrocarbons will increase density porosity.
collisions result in a loss of energy from the gammia ray
Oil does not significantly affect density porosity, but gas
particle. Tittman and Wahl (1965) called the interaction
does (gas effect). Hilchie (1978) suggests using a gas
between incoming gamma ray particles and electrons in the
density of 0.7 gm/ce for fluid density (p,) in the density
formation. Compton Scattering. Scattered gamma rays
porosity formula if gas density is unknown.
which reach the detector, located a fixed distance from the
gamma ray source. are counted as an indicator of formation
Neutron Logs
density. The number of Compton Scattering collisions is a
direct function of the number of electrons in a formation Neutron logs are porosity logs that measure the hydrogen
(electron density). Consequently, electron density can be ion concentration in a formation. In clean formations (i.e.
related to bulk density (p,) of a formation in gm/cc. shale-free) where the porosity is filled with water or oil, the
The bulk density curve is recorded in tracks #2 and #3 neutron log measures liquid-filled porosity.
(Fig. 28), along with a correction curve (A,,). Because the Neutrons are created from a chemical source in the
modern density log is acompensated log (dual detectors), neutron logging tool. The chemical source may be a mixture
the correction curve (A,,; Fig. 28) records how much of arericium and bery!lium which will continuously eniit
correction has deen applied to the bulk density curve (p4), neutrons. These neutrons collide with the nuclei of the
due to borehole irregularities. Whenever the correction formation material, and result in a neutron losing some of
curve (A, )execeds 0.20 ginicc, the value of the bulk density its cnergy. Because the hydrogen atom Is almost equal in
obtained from the bulk density curve (pp) should be mass to the neutron, maximum energy loss occurs when the
considered invalid. A density derived porosity curve Is neutron collides with a hydrogen atom. Therefore, the
sometimes present in tracks #2 and #3 along with the bulk maximum amount of energy loss ts a function of a
density (p,) and correction (A,) curves. Track #1 contains a formation’s hydrogen concentration. Because hydrogen ina
Ojon = density derived porosity
gamuia ray log and a caliper (example. Fig. 28). porous formation is concentrated in the fluid-filled pores,
energy loss can be related to the formation’s porosity.
Formation bulk density (p,) is a function of matrix
density, porosity, and density of the fluid in the pores (salt Whenever pores are filled with gas rather than oil or
mud, fresh mud. or hydrocarbons). To determine density water, neutron porosity will be lowered. This occurs
porosity, either by chart (Fig. 29) or by calculation, the because there is less concentration of hydrogen in gas
matrix density (Table 7) and type of fluid in the borehole compared to oil or water. A lowering of neutron porosity by
must be known. The formula for calculating density gas 18 called gas effect.
porosity is: — Pma = Pr and (3) lithology—i.c. sandstone, timestone, and dolomite.
Neutron log responses vary, depending on: (1) differences
in detector types. (2) spacing between source and detector,
using the appropriate charts (Figs. 30 and 31). A geologist
Where: Pben Pma ~ Pf These variations in response can be compensated for by
should remember that neutron logs (unlike all other logs)
67