
Page 98 - Basic Well Log Analysis for Geologist
P. 98
POROSITY LOGS
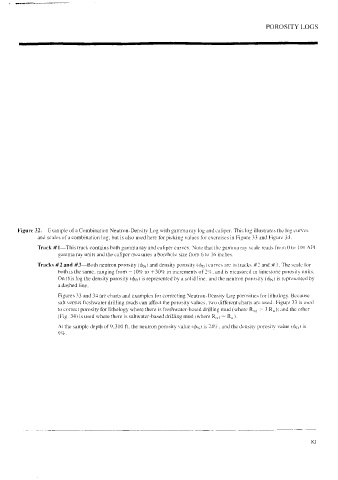
Figure 32. Example of a Combination Neutron-Density Log with gamma ray log and caliper. This log illustrates the log curves
and scales of a combination log, but is also used here for picking values for exercises in Figure 33 and Figure 34.
Track # 1—This track contains both gamma ray and caliper curves. Note that the gamma ray scale reads from 0 to 100 API
gamma ray units and the caliper measures a borehole size from 6 to 16 inches.
Tracks #2 and #3—Both neutron porosity (dy) and density porosity (dp) curves are in tracks #2 and #3. The scale tor
both is the same. ranging from — 10% to +30% in increments of 2%. and is measured in limestone porosity units.
On this log the density porosity (@p) is represented by a solid line, and the neutron porosity («bp;) is represented by
a dashed line.
Figures 33 and 34 are charts and examples for correcting Neutron-Density Log porosities for lithology. Because
salt versus freshwater drilling muds can affect the porosity values, two different charts are used. Figure 33 is used
to correct porosity for lithology where there is freshwater-based drilling mud (where R,y > 3 R,,); and the other
(Fig. 34) is used where there is saltwater-based drilling mud (where Rj = R,,).
At the sample depth of 9,310 ft, the neutron porosity value (@x) is 24%. and the density porosity value (bp) is
9%.
83