
Page 106 - Basics of MATLAB and Beyond
P. 106
>> [x,y] = meshgrid(1:5,1:3)
x =
1 2 3 4 5
1 2 3 4 5
1 2 3 4 5
y =
1 1 1 1 1
2 2 2 2 2
3 3 3 3 3
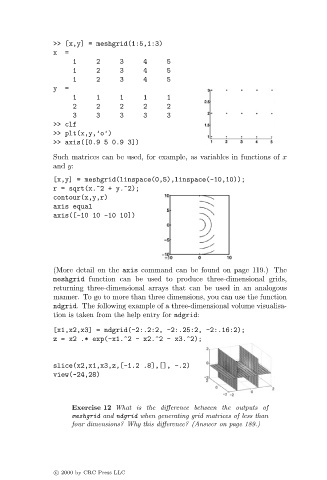
>> clf
>> plt(x,y,’o’)
>> axis([0.9 5 0.9 3])
Such matrices can be used, for example, as variables in functions of x
and y:
[x,y] = meshgrid(linspace(0,5),linspace(-10,10));
r = sqrt(x.^2 + y.^2);
contour(x,y,r)
axis equal
axis([-10 10 -10 10])
(More detail on the axis command can be found on page 119.) The
meshgrid function can be used to produce three-dimensional grids,
returning three-dimensional arrays that can be used in an analogous
manner. To go to more than three dimensions, you can use the function
ndgrid. The following example of a three-dimensional volume visualisa-
tion is taken from the help entry for ndgrid:
[x1,x2,x3] = ndgrid(-2:.2:2, -2:.25:2, -2:.16:2);
z = x2 .* exp(-x1.^2 - x2.^2 - x3.^2);
slice(x2,x1,x3,z,[-1.2 .8],[], -.2)
view(-24,28)
Exercise 12 What is the difference between the outputs of
meshgrid and ndgrid when generating grid matrices of less than
four dimensions? Why this difference? (Answer on page 189.)
c 2000 by CRC Press LLC