
Page 382 - Battery Reference Book
P. 382
Traction or motive power type 3W9
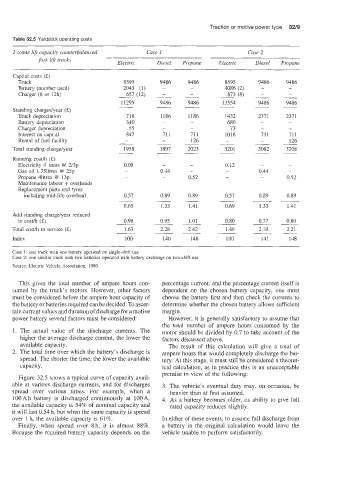
Table 32.5 Yardstick operating costs
2-tonne lift capacity counterbalanced Case 1 Case 2
fork lift trucks Electric Diesel Propane Electric Diesel Propane
Capital costs (5)
Truck 8595 9486 9486 8595 9486 9486
Battery (number used) 2043 (I) - - 4086 (2) - -
-
Charger (8 or 12h) 657 (12) - - 873 (8) - -
~ ~
11295 9486 9486 13554 9486 9486
Standing chargeslyear (E) ~ ~
Truck depreciation 716 1186 1432 2371 2371
Battery depreciation 340 - 680 - -
Charger depreciation 55 - 73 - -
Interest on capi:al 847 711 1016 711 7i1
-
Rental of fuel facility ___ ~ 126 - - 126
Total standing charge/year 1958 1897 2023 3201 3082 3208
~
Running costh (E)
Electricity 4 units @ 2I3p 0.08 - - 0.12 - -
Gas oil 1.75litres @ 25p - 0.44 - - 0.44 -
Propane 4litres @ 13p - - 0.52 - - 0.52
Maintenance labour + overheads
Replacement pats and tyres
including mid-life overhaul 0.57 0.89 0.89 0.57 0.89 0.89
~
0.65 1.33 1.41 0.69 1.33 1.41
Add standing charge/year reduced
to costh (g.) 0.98 0.95 1.01 0.80 0.77 0.80
Total costh in service (5) 1.63 2.28 2.42 1.49 2.10 2.21
Index 100 140 148 100 141 148
Case 1: one truck with one battery operated on single-shift use
Case 2: one similar mck with two batteries operated with battery exchange on two-shift use
Source: Electric Vehicle Association, 1980
This gives the total number of ampere hours con- percentage current, and the percentage current itself is
sumed by the truck’s motors. However, other factors dependent on the chosen battery capacity, one must
must be considered before the ampere hour capacity of choose the battery first and then check the currents to
the battery or batteries required can be decided. To ascer- determine whether the chosen battery allows sufficient
tain current values and duration of discharge for a motive margin.
power battery several factors must be considered: However, it is generally satisfactory to assume that
the total number of ampere hours consumed by the
1. The actual value of the discharge currents. The motor should be divided by 0.7 to take account of the
higher the average discharge current, the lower the factors discussed above.
available capacity. The result of this calculation will give a total of
2. The total time over which the battery’s discharge is ampere hours that would completely discharge the bat-
spread. The shorter the time, the lower the available tery. At this stage, it must still be considered a theoret-
capacity. ical calculation, as in practice this is an unacceptable
premise in view of the following:
Figure 32.5 shows a typical curve of capacity avail-
able at various discharge currenl.s, and for discharges 3. The vehicle’s eventual duty may, on occasion, be
spread over various times. For example, when a heavier than at first assumed.
LOOAh battery IS discharged continuously at 100A, 4. As a battery becomes older, its ability to give full
the available ca19acity is 54% of nominal capacity and rated capacity reduces slightly.
it will last 0.54 h, but when the same capacity is spread
over 1 h, the available capacity is 61%. In either of these events, to assume full discharge from
Finally, when spread over 8h, it is almost 88%. a battery in the original calculation would leave the
Because the required battery capacity depends on the vehicle unable to perform satisfactorily.