
Page 168 - Becoming Metric Wise
P. 168
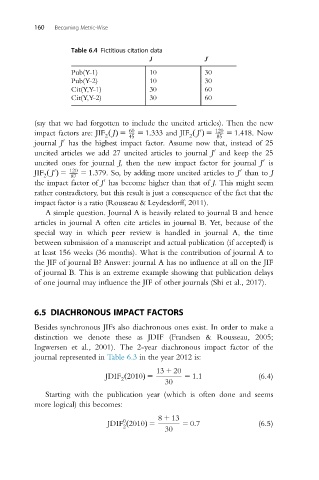
160   Becoming Metric-Wise


                    Table 6.4 Fictitious citation data
                                         J              J 0
                    Pub(Y-1)             10             30
                    Pub(Y-2)             10             30
                    Cit(Y,Y-1)           30             60
                    Cit(Y,Y-2)           30             60


          (say that we had forgotten to include the uncited articles). Then the new
          impact factors are: JIF JðÞ 5  60  5 1:333 and JIF ð J Þ 5  120  5 1:418. Now
                                                       0
                             2      45              2       85
                  0
          journal J has the highest impact factor. Assume now that, instead of 25
          uncited articles we add 27 uncited articles to journal J and keep the 25
                                                           0
                                                                        0
          uncited ones for journal J, then the new impact factor for journal J is
          JIF ð J Þ 5  120  5 1:379. So, by adding more uncited articles to J than to J
                0
                                                                  0
             2
                    87
          the impact factor of J has become higher than that of J. This might seem
                             0
          rather contradictory, but this result is just a consequence of the fact that the
          impact factor is a ratio (Rousseau & Leydesdorff, 2011).
             A simple question. Journal A is heavily related to journal B and hence
          articles in journal A often cite articles in journal B. Yet, because of the
          special way in which peer review is handled in journal A, the time
          between submission of a manuscript and actual publication (if accepted) is
          at least 156 weeks (36 months). What is the contribution of journal A to
          the JIF of journal B? Answer: journal A has no influence at all on the JIF
          of journal B. This is an extreme example showing that publication delays
          of one journal may influence the JIF of other journals (Shi et al., 2017).


          6.5 DIACHRONOUS IMPACT FACTORS

          Besides synchronous JIFs also diachronous ones exist. In order to make a
          distinction we denote these as JDIF (Frandsen & Rousseau, 2005;
          Ingwersen et al., 2001). The 2-year diachronous impact factor of the
          journal represented in Table 6.3 in the year 2012 is:
                                           13 1 20
                              JDIF ð2010Þ 5        5 1:1               (6.4)
                                  2
                                              30
             Starting with the publication year (which is often done and seems
          more logical) this becomes:
                                            8 1 13
                                  0
                              JDIF ð2010Þ 5       5 0:7                (6.5)
                                  2
                                              30