
Page 181 - Becoming Metric Wise
P. 181
173
Journal Citation Analysis
more important than receiving a citation from journals with long
reference lists (typically review journals).
• A 5-year publication window is used, while the classical JIF uses a
2-year publication window.
• These indicators use information from the whole network and not
just from directly citing journals.
• Journal self-citations are not used.
• They are based on a solid mathematical theory of matrices and
eigenvalues.
• The method satisfies an axiomatic uniqueness property (Palacios-
Huerta & Volij, 2004).
• These indicators embed citation analysis in the field of (social) net-
work theory where eigenvector centrality is one of the basic centrality
measures (Bonacich, 1972, 1987). Networks are discussed in
Chapter 10, Networks.
6.10 CORRELATIONS BETWEEN JOURNAL INDICATORS
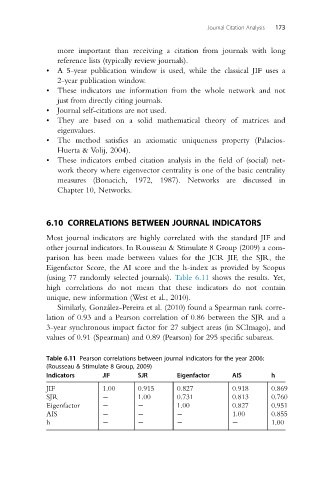
Most journal indicators are highly correlated with the standard JIF and
other journal indicators. In Rousseau & Stimulate 8 Group (2009) a com-
parison has been made between values for the JCR JIF, the SJR, the
Eigenfactor Score, the AI score and the h-index as provided by Scopus
(using 77 randomly selected journals). Table 6.11 shows the results. Yet,
high correlations do not mean that these indicators do not contain
unique, new information (West et al., 2010).
Similarly, Gonza ´lez-Pereira et al. (2010) found a Spearman rank corre-
lation of 0.93 and a Pearson correlation of 0.86 between the SJR and a
3-year synchronous impact factor for 27 subject areas (in SCImago), and
values of 0.91 (Spearman) and 0.89 (Pearson) for 295 specific subareas.
Table 6.11 Pearson correlations between journal indicators for the year 2006:
(Rousseau & Stimulate 8 Group, 2009)
Indicators JIF SJR Eigenfactor AIS h
JIF 1.00 0.915 0.827 0.918 0.869
SJR 1.00 0.731 0.813 0.760
Eigenfactor 1.00 0.827 0.951
AIS 1.00 0.855
h 1.00