
Page 207 - Becoming Metric Wise
P. 207
197
Journal Citation Analysis
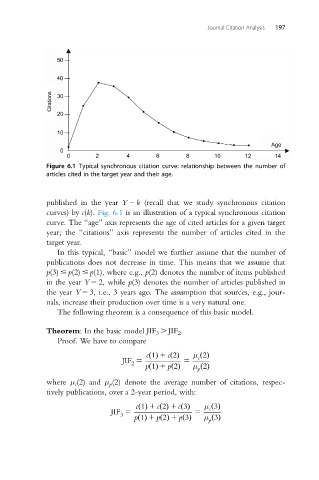
Figure 6.1 Typical synchronous citation curve: relationship between the number of
articles cited in the target year and their age.
published in the year Y 2 k (recall that we study synchronous citation
curves) by c(k). Fig. 6.1 is an illustration of a typical synchronous citation
curve. The “age” axis represents the age of cited articles for a given target
year; the “citations” axis represents the number of articles cited in the
target year.
In this typical, “basic” model we further assume that the number of
publications does not decrease in time. This means that we assume that
p(3) # p(2) # p(1), where e.g., p(2) denotes the number of items published
in the year Y 2 2, while p(3) denotes the number of articles published in
the year Y 2 3, i.e., 3 years ago. The assumption that sources, e.g., jour-
nals, increase their production over time is a very natural one.
The following theorem is a consequence of this basic model.
Theorem: In the basic model JIF 3 . JIF 2 .
Proof. We have to compare
cð1Þ 1 cð2Þ μ ð2Þ
c
JIF 5 5
2
pð1Þ 1 pð2Þ μ ð2Þ
p
where μ c (2) and μ p (2) denote the average number of citations, respec-
tively publications, over a 2-year period, with:
cð1Þ 1 cð2Þ 1 cð3Þ μ ð3Þ
JIF 5 5 c
3
pð1Þ 1 pð2Þ 1 pð3Þ μ ð3Þ
p