
Page 317 - Becoming Metric Wise
P. 317
309
The Informetric Laws
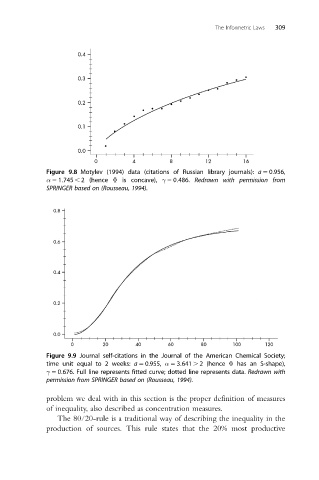
Figure 9.8 Motylev (1994) data (citations of Russian library journals): a 5 0.956,
α 5 1:745 , 2 (hence Φ is concave), γ 5 0:486. Redrawn with permission from
SPRINGER based on (Rousseau, 1994).
Figure 9.9 Journal self-citations in the Journal of the American Chemical Society;
time unit equal to 2 weeks: a 5 0.955, α 5 3:641 . 2 (hence Φ has an S-shape),
γ 5 0:676. Full line represents fitted curve; dotted line represents data. Redrawn with
permission from SPRINGER based on (Rousseau, 1994).
problem we deal with in this section is the proper definition of measures
of inequality, also described as concentration measures.
The 80/20-rule is a traditional way of describing the inequality in the
production of sources. This rule states that the 20% most productive