
Page 257 - Biofuels for a More Sustainable Future
P. 257
232 Biofuels for a More Sustainable Future
1 1
0
1 0 2 0 0
0 1 0 1
0 1
0 1 5 0
B C
B 0 C
B 0 C B 2:5 C
1 B C B C B C
s p ¼ A f p ¼ B 0 0 1 5 0 C 0:5 (8.7)
p B 0 C ¼ B C
B C
@ A @ 0:1 A
0 0 0
B C 0
1 0:5
@ 5 1 A
0 0 0 10 0
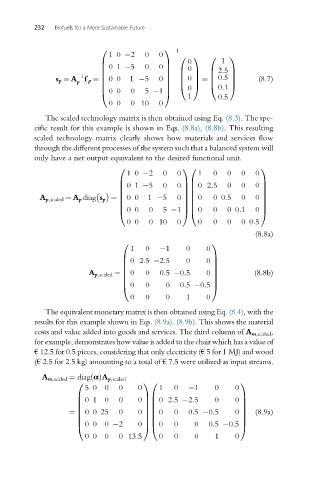
The scaled technology matrix is then obtained using Eq. (8.3). The spe-
cific result for this example is shown in Eqs. (8.8a), (8.8b). This resulting
scaled technology matrix clearly shows how materials and services flow
through the different processes of the system such that a balanced system will
only have a net output equivalent to the desired functional unit.
0 10 1
1 0 2 0 0 1 0 0 0 0
0 1 5 0 0 2:5 0 0
B CB C
B 0 CB 0 C
B CB C
A p,scaled ¼ A p diag s p ¼ B 0 0 1 5 0 CB 0 0 0:5 0 0 C
B CB C
0 0 0 0 0 0 0:1
B CB C
@ 5 1 A@ 0 A
0 0 0 10 0 0 0 0 0 0:5
(8.8a)
0 1
1 0 1 0 0
0 2:5 2:5 0
B C
B 0 C
B C
A p,scaled ¼ B 0 0 0:5 0:5 0 C (8.8b)
B C
0 0 0
B C
@ 0:5 0:5 A
0 0 0 1 0
The equivalent monetary matrix is then obtained using Eq. (8.4),withthe
results for this example shown in Eqs. (8.9a), (8.9b). This shows the material
costs and value added into goods and services. The third column of A m,scaled ,
for example, demonstrates how value is added to the chair which has a value of
€ 12.5 for 0.5 pieces, considering that only electricity (€ 5 for 1 MJ) and wood
(€ 2.5 for 2.5 kg) amounting to a total of € 7.5 were utilized as input streams.
A m,scaled ¼ diag αðÞA p,scaled
0 10 1
5 0 0 0 0 1 0 1 0 0
0 1 0 0 0 2:5 2:5 0
B CB C
B 0 CB 0 C
B CB C
¼ B 0 0 25 0 0 CB 0 0 0:5 0:5 0 C (8.9a)
B CB C
0 0 0 2 0 0 0
B CB C
@ 0 A@ 0:5 0:5 A
0 0 0 0 13:5 0 0 0 1 0