
Page 418 - Biofuels for a More Sustainable Future
P. 418
372 Biofuels for a More Sustainable Future
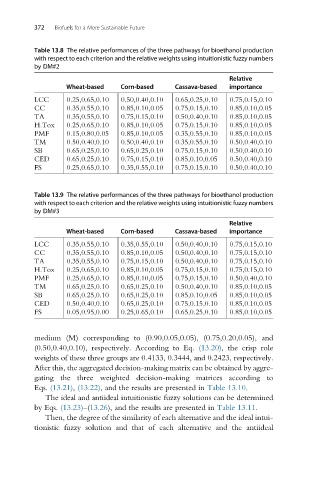
Table 13.8 The relative performances of the three pathways for bioethanol production
with respect to each criterion and the relative weights using intuitionistic fuzzy numbers
by DM#2
Relative
Wheat-based Corn-based Cassava-based importance
LCC 0.25,0.65,0.10 0.50,0.40,0.10 0.65,0.25,0.10 0.75,0.15,0.10
CC 0.35,0.55,0.10 0.85,0.10,0.05 0.75,0.15,0.10 0.85,0.10,0.05
TA 0.35,0.55,0.10 0.75,0.15,0.10 0.50,0.40,0.10 0.85,0.10,0.05
H.Tox 0.25,0.65,0.10 0.85,0.10,0.05 0.75,0.15,0.10 0.85,0.10,0.05
PMF 0.15,0.80,0.05 0.85,0.10,0.05 0.35,0.55,0.10 0.85,0.10,0.05
TM 0.50,0.40,0.10 0.50,0.40,0.10 0.35,0.55,0.10 0.50,0.40,0.10
SB 0.65,0.25,0.10 0.65,0.25,0.10 0.75,0.15,0.10 0.50,0.40,0.10
CED 0.65,0.25,0.10 0.75,0.15,0.10 0.85,0.10,0.05 0.50,0.40,0.10
FS 0.25,0.65,0.10 0.35,0.55,0.10 0.75,0.15,0.10 0.50,0.40,0.10
Table 13.9 The relative performances of the three pathways for bioethanol production
with respect to each criterion and the relative weights using intuitionistic fuzzy numbers
by DM#3
Relative
Wheat-based Corn-based Cassava-based importance
LCC 0.35,0.55,0.10 0.35,0.55,0.10 0.50,0.40,0.10 0.75,0.15,0.10
CC 0.35,0.55,0.10 0.85,0.10,0.05 0.50,0.40,0.10 0.75,0.15,0.10
TA 0.35,0.55,0.10 0.75,0.15,0.10 0.50,0.40,0.10 0.75,0.15,0.10
H.Tox 0.25,0.65,0.10 0.85,0.10,0.05 0.75,0.15,0.10 0.75,0.15,0.10
PMF 0.25,0.65,0.10 0.85,0.10,0.05 0.75,0.15,0.10 0.50,0.40,0.10
TM 0.65,0.25,0.10 0.65,0.25,0.10 0.50,0.40,0.10 0.85,0.10,0.05
SB 0.65,0.25,0.10 0.65,0.25,0.10 0.85,0.10,0.05 0.85,0.10,0.05
CED 0.50,0.40,0.10 0.65,0.25,0.10 0.75,0.15,0.10 0.85,0.10,0.05
FS 0.05,0.95,0.00 0.25,0.65,0.10 0.65,0.25,0.10 0.85,0.10,0.05
medium (M) corresponding to (0.90,0.05,0.05), (0.75,0.20,0.05), and
(0.50,0.40,0.10), respectively. According to Eq. (13.20), the crisp role
weights of these three groups are 0.4133, 0.3444, and 0.2423, respectively.
After this, the aggregated decision-making matrix can be obtained by aggre-
gating the three weighted decision-making matrices according to
Eqs. (13.21), (13.22), and the results are presented in Table 13.10.
The ideal and antiideal intuitionistic fuzzy solutions can be determined
by Eqs. (13.23)–(13.26), and the results are presented in Table 13.11.
Then, the degree of the similarity of each alternative and the ideal intui-
tionistic fuzzy solution and that of each alternative and the antiideal