
Page 124 - Biosystems Engineering
P. 124
Soil and W ater Conservation 105
3.5.1 Infiltration
Infiltration is the process of water penetrating into the soil. The infil-
tration rate is affected by many factors such as soil moisture content
(antecedent water content), soil physical characteristics (hydraulic
conductivity, porosity, etc.), rainfall intensity, and condition of soil
and vegetation cover.
Water movement in soil is governed by the Darcy’s law:
q =− K dh (3.12)
dz
where q is the water flux or discharge per unit area [L/T], K is the
hydraulic conductivity [L/T], h is the total head [L], and z is the
vertical distance positive upward [L]. The negative sign indicates
that flow direction is from higher head to lower head. Infiltration
rate ( f ) is the flow rate at which water enters the soil per unit area.
It has the same unit with rainfall intensity (i) (i.e., length per unit
time [L/T]). Potential infiltration rate or infiltration capacity ( f ) is the
p
infiltration rate when there is no shortage of water supply to the
soil. In other words, when rainfall intensity exceeds the infiltration
rate (i.e., i > f ), then f = f . Conversely, when i < f, then f = i. Cumula-
c
tive infiltration (F) is the total volume of water infiltrated per unit
area from the onset of the infiltration process up to time t. It has the
unit of length [L]. Mathematically, cumulative infiltration is related
to infiltration rate by
t dF t()
τ
Ft() = ∫ f( ) dτ or f t() = (3.13)
dt
0
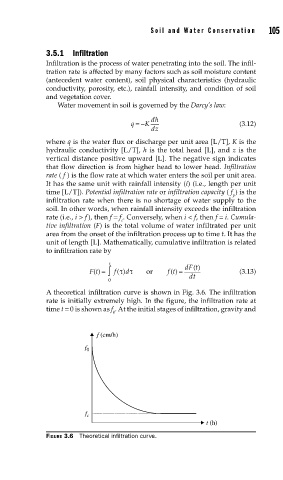
A theoretical infiltration curve is shown in Fig. 3.6. The infiltration
rate is initially extremely high. In the figure, the infiltration rate at
time t = 0 is shown as f . At the initial stages of infiltration, gravity and
0
f (cm/h)
f 0
f c
t (h)
FIGURE 3.6 Theoretical infi ltration curve.