
Page 141 - Biosystems Engineering
P. 141
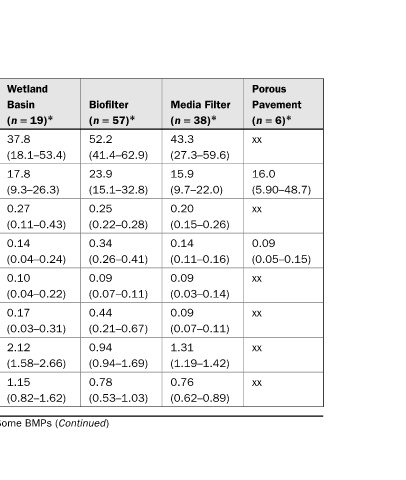
Porous  Pavement  = 6) *  (n  xx  16.0  (5.90–48.7)  xx  0.09  (0.05–0.15)  xx  xx  xx  xx


                   Media Filter  = 38) *  (n  43.3  (27.3–59.6)  15.9  (9.7–22.0)  0.20  (0.15–0.26)  0.14  (0.11–0.16)  0.09  (0.03–0.14)  0.09  (0.07–0.11)  1.31  (1.19–1.42)  0.76  (0.62–0.89)


                   Biofilter  = 57) *  (n  52.2  (41.4–62.9)  23.9  (15.1–32.8)  0.25  (0.22–0.28)  0.34  (0.26–0.41)  0.09  (0.07–0.11)  0.44  (0.21–0.67)  0.94  (0.94–1.69)  0.78  (0.53–1.03)


                Wetland  Basin  = 19) *  (n  37.8  (18.1–53.4)  17.8  (9.3–26.3)  0.27  (0.11–0.43)  0.14  (0.04–0.24)  0.10  (0.04–0.22)  0.17  (0.03–0.31)  2.12  (1.58–2.66)  1.15  (0.82–1.62)


                   Wet Pond  = 46) *  (n  34.1  (19.2–49.1)  13.4  (7.3–19.5)  0.21  (0.13–0.29)  0.12  (0.09–0.16)  0.09  (0.06–0.13)  0.08  (0.04–0.11)  1.64  (1.39–1.94)  1.43  (1.17–1.68) Median of Average Influent and Effluent Concentrations of Some BMPs (Continued)


                 Detention  Pond  = 25) *  (n  72.7  (41.7–103.6)  31.0  (16.1–46.0)  0.19  (0.17–0.22)  0.19  (0.12–0.27)  0.09  (0.06–0.13)  0.12  (0.07–0.18)  1.25  (0.83–1.66)  2.72  (1.81–3.63)


                   Sample  Location  Influent  Effluent  Influent  Effluent  Influent  Effluent  Influent  Effluent


                     Constituent  TSS (mg/L)  Total P (mg/L)  Diss. P (mg/L)  Total N (mg/L)  TABLE 3.2


                                                                           121