
Page 375 - Biosystems Engineering
P. 375
352 Cha pte r T w e l v e
(Rozenberg and Cahalan 1997). The negative phenotypic and genetic
relationships between diameter growth and wood density seem very
general within the genus Picea. They are moderate for Sitka spruce
and other North American spruces, and most of the time, stronger for
Norway spruce.
In several cases, bacterial genes have been used to alter plant form
and performance. The use of the iaaM and iaaH auxin-biosynthetic
genes from Agrobacterium tumefaciens significantly affected several
wood characteristics in transgenic hybrid aspen: the transgenic trees
were generally smaller than the controls, exhibiting reduced growth
rate, leaf size, and stem diameter (Tuominen et al. 1995). Although
these changes seem undesirable for the improvement of wood quality,
other changes, such as a reduction in the number of side shoots fol-
lowing decapitation and changes in the xylem structure and composi-
tion, show some potential for transgenic trees to express these genes.
Transgenic hybrid aspen plants overexpressing a peroxidase gene
showed an increase of approximately 17 percent of stem length com-
pared with untransformed control trees. Although little is known
about the precise action of peroxidase family genes, their use for
improving plant performance seems possible, as they showed a simi-
lar accelerated-growth phenotype in tobacco (Tzfira et al. 1998).
12.3.2 Physical and Mechanical Properties
Density and Mechanical Properties
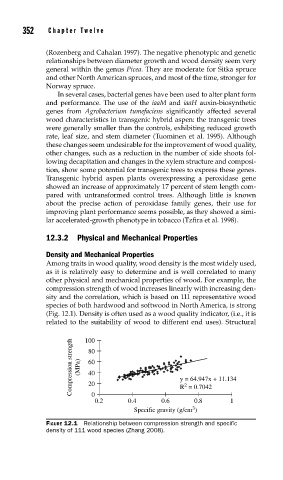
Among traits in wood quality, wood density is the most widely used,
as it is relatively easy to determine and is well correlated to many
other physical and mechanical properties of wood. For example, the
compression strength of wood increases linearly with increasing den-
sity and the correlation, which is based on 111 representative wood
species of both hardwood and softwood in North America, is strong
(Fig. 12.1). Density is often used as a wood quality indicator, (i.e., it is
related to the suitability of wood to different end uses). Structural
Compression strength (MPa) 80 y = 64.947x + 11.134
100
60
40
20
2
0
0.8
0.2 0.4 0.6 R = 0.7042 1
3
Specific gravity (g/cm )
FIGURE 12.1 Relationship between compression strength and specifi c
density of 111 wood species (Zhang 2008).