
Page 385 - Biosystems Engineering
P. 385
362 Cha pte r T w e l v e
deg 070324NCM phase002
40
–10
30
–20
μm
–30 20
–40
10
–50
0
0 10 20 30 40
μm
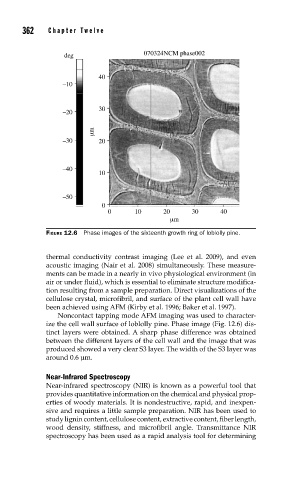
FIGURE 12.6 Phase images of the sixteenth growth ring of loblolly pine.
thermal conductivity contrast imaging (Lee et al. 2009), and even
acoustic imaging (Nair et al. 2008) simultaneously. These measure-
ments can be made in a nearly in vivo physiological environment (in
air or under fluid), which is essential to eliminate structure modifica-
tion resulting from a sample preparation. Direct visualizations of the
cellulose crystal, microfibril, and surface of the plant cell wall have
been achieved using AFM (Kirby et al. 1996; Baker et al. 1997).
Noncontact tapping mode AFM imaging was used to character-
ize the cell wall surface of loblolly pine. Phase image (Fig. 12.6) dis-
tinct layers were obtained. A sharp phase difference was obtained
between the different layers of the cell wall and the image that was
produced showed a very clear S3 layer. The width of the S3 layer was
around 0.6 μm.
Near-Infrared Spectroscopy
Near-infrared spectroscopy (NIR) is known as a powerful tool that
provides quantitative information on the chemical and physical prop-
erties of woody materials. It is nondestructive, rapid, and inexpen-
sive and requires a little sample preparation. NIR has been used to
study lignin content, cellulose content, extractive content, fiber length,
wood density, stiffness, and microfibril angle. Transmittance NIR
spectroscopy has been used as a rapid analysis tool for determining