Page 442 - Biosystems Engineering
P. 442

Exogenous Bior egulators–Fruit Composition & Storability       419

                                      Magnesium content in fruits

                   0.07
                   0.06
                   0.05
                 %  0.04
                   0.03
                   0.02
                   0.01
                     0
                       1  2  3  4  5  6  7  8  9  10 11 12 13 14
                        b      a       b            b      b             b     b             ab    b             b  Exp. 1
                        a      b      ab   ab   ab    ab    ab    ab    ab    bc    ab    ab    bc    c   Exp. 2
                                                                 Exp. 3
                       abc abc     bc   bc   abc    a      a     ab    bc    bc    ab    ab    bc    c
                                     Magnesium content in seeds
                   0.6
                   0.5
                   0.4
                 %
                   0.3
                   0.2
                   0.1
                    0
                       1  2  3  4  5  6  7  8  9  10 11 12 13 14   Exp. 1
                                                                   Exp. 2
                       n.s.                                        Exp. 3
                                     Magnesium content in leaves

                   0.25
                   0.2

                 %  0.15
                   0.1
                   0.05
                     0
                       1  2  3  4  5  6  7  8  9  10 11 12 13 14
                        abc   a     bc         abc  abc           bc    ab            c      c            abc   Exp. 1
                        n.s.                                     Exp. 2
                        n.s.                                     Exp. 3
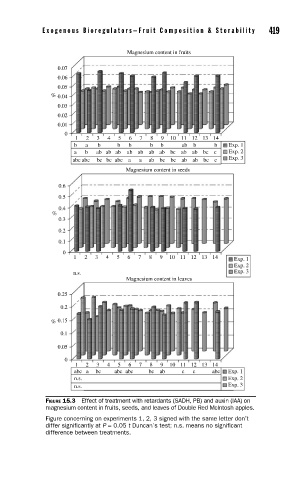
               FIGURE 15.3  Effect of treatment with retardants (SADH, PB) and auxin (IAA) on
               magnesium content in fruits, seeds, and leaves of Double Red McIntosh apples.
               Figure concerning on experiments 1, 2, 3 signed with the same letter don’t
               differ significantly at P = 0.05 t Duncan’s test; n.s. means no significant
               difference between treatments.
   437   438   439   440   441   442   443   444   445   446   447