
Page 457 - Biosystems Engineering
P. 457
Exogenous Bior egulators–Fruit Composition & Storability 431
on the size and appearance of the apples during harvest are found
elsewhere. This chapter contains only data concerning the internal
quality of apples, their firmness, soluble solids, and sap starch con-
tent during harvest and after storage, as well as the susceptibility to
rotting, shriveling, and physiological disorders.
The apples were stored in common cold storage at 2 to 3°C and
about 90 percent relative humidity during the period similar as for
commercially treated apples.
Each treatment was done for six to eight similar trees (one tree
was a plot). Liberal spraying was done with a lance sprayer, until the
droplets started to drip.
Analysis of variance was applied with Duncan’s t test at P =.05 to
separate the means.
In the first experiment, on Gala apples (data not shown in Table 15.4),
only urea at 6 percent applied at the beginning of petal fall caused
reduction of the crop load. Urea also caused a distinct improvement
in apple size. However, this compound, regardless of its concentration
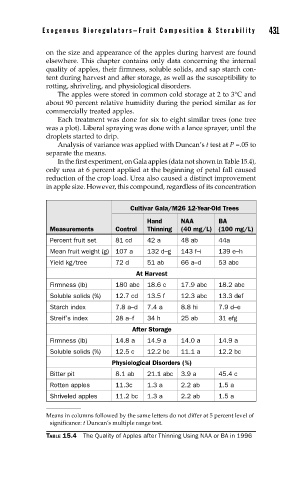
Cultivar Gala/M26 12-Year-Old Trees
Hand NAA BA
Measurements Control Thinning (40 mg/L) (100 mg/L)
Percent fruit set 81 cd 42 a 48 ab 44a
Mean fruit weight (g) 107 a 132 d–g 143 f–i 139 e–h
Yield kg/tree 72 d 51 ab 66 a–d 53 abc
At Harvest
Firmness (lb) 180 abc 18.6 c 17.9 abc 18.2 abc
Soluble solids (%) 12.7 cd 13.5 f 12.3 abc 13.3 def
Starch index 7.8 a–d 7.4 a 8.8 hi 7.9 d–e
Streif’s index 28 a–f 34 h 25 ab 31 efg
After Storage
Firmness (lb) 14.8 a 14.9 a 14.0 a 14.9 a
Soluble solids (%) 12.5 c 12.2 bc 11.1 a 12.2 bc
Physiological Disorders (%)
Bitter pit 8.1 ab 21.1 abc 3.9 a 45.4 c
Rotten apples 11.3c 1.3 a 2.2 ab 1.5 a
Shriveled apples 11.2 bc 1.3 a 2.2 ab 1.5 a
Means in columns followed by the same letters do not differ at 5 percent level of
significance: t Duncan’s multiple range test.
TABLE 15.4 The Quality of Apples after Thinning Using NAA or BA in 1996