
Page 102 - Caldera Volcanism Analysis, Modelling and Response
P. 102
Pyroclastic Density Currents 77
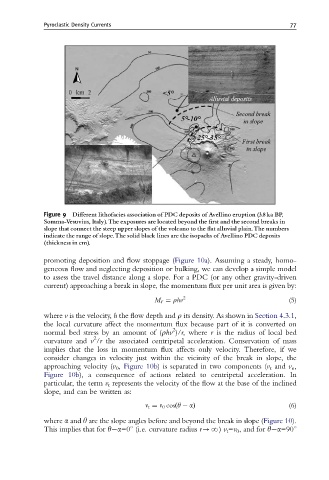
Figure 9 Di¡erent lithofacies association of PDC deposits of Avellino eruption (3.8 ka BP,
Somma-Vesuvius, Italy).The exposures are located beyond the ¢rst and the second breaks in
slope that connect the steep upper slopes of the volcano to the £at alluvial plain.The numbers
indicate the range of slope.The solid black lines are the isopachs of Avellino PDC deposits
(thickness in cm).
promoting deposition and flow stoppage (Figure 10a). Assuming a steady, homo-
geneous flow and neglecting deposition or bulking, we can develop a simple model
to assess the travel distance along a slope. For a PDC (or any other gravity-driven
current) approaching a break in slope, the momentum flux per unit area is given by:
M f ¼ rhv 2 (5)
where v is the velocity, h the flow depth and r its density. As shown in Section 4.3.1,
the local curvature affect the momentum flux because part of it is converted on
2
normal bed stress by an amount of (rhv )/r,where r is the radius of local bed
2
curvature and v /r the associated centripetal acceleration. Conservation of mass
implies that the loss in momentum flux affects only velocity. Therefore, if we
consider changes in velocity just within the vicinity of the break in slope, the
approaching velocity (v 0 , Figure 10b) is separated in two components (v t and v n ,
Figure 10b), a consequence of actions related to centripetal acceleration. In
particular, the term v t represents the velocity of the flow at the base of the inclined
slope, and can be written as:
n t ¼ n 0 cosðy aÞ (6)
where a and y are the slope angles before and beyond the break in slope (Figure 10).
This implies that for y a=01 (i.e. curvature radius r-N) v t =v 0 , and for y a=901