
Page 151 - Caldera Volcanism Analysis, Modelling and Response
P. 151
126 A. Pittari et al.
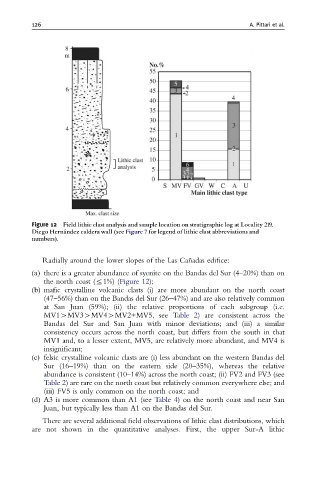
Figure 12 Field lithic clast analysis and sample location on stratigraphic log at Locality 219,
Diego Herna Ł ndez caldera wall (see Figure 7 for legend of lithic clast abbreviations and
numbers).
Radially around the lower slopes of the Las Can ˜adas edifice:
(a) there is a greater abundance of syenite on the Bandas del Sur (4–20%) than on
the north coast (r1%) (Figure 12);
(b) mafic crystalline volcanic clasts (i) are more abundant on the north coast
(47–56%) than on the Bandas del Sur (26–47%) and are also relatively common
at San Juan (59%); (ii) the relative proportions of each subgroup (i.e.
MV1WMV3WMV4WMV2+MV5, see Table 2) are consistent across the
Bandas del Sur and San Juan with minor deviations; and (iii) a similar
consistency occurs across the north coast, but differs from the south in that
MV1 and, to a lesser extent, MV5, are relatively more abundant, and MV4 is
insignificant;
(c) felsic crystalline volcanic clasts are (i) less abundant on the western Bandas del
Sur (16–19%) than on the eastern side (20–35%), whereas the relative
abundance is consistent (10–14%) across the north coast; (ii) FV2 and FV3 (see
Table 2) are rare on the north coast but relatively common everywhere else; and
(iii) FV5 is only common on the north coast; and
(d) A3 is more common than A1 (see Table 4) on the north coast and near San
Juan, but typically less than A1 on the Bandas del Sur.
There are several additional field observations of lithic clast distributions, which
are not shown in the quantitative analyses. First, the upper Sur-A lithic