
Page 268 - Caldera Volcanism Analysis, Modelling and Response
P. 268
A Review on Collapse Caldera Modelling 243
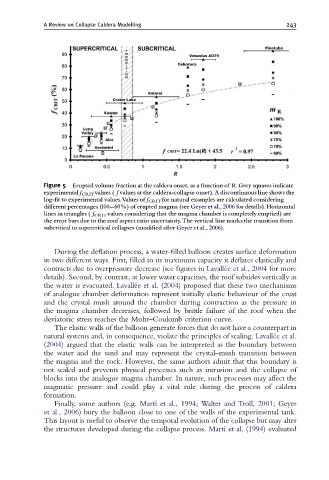
Figure 5 Erupted volume fraction at the caldera onset, as a function of R. Grey squares indicate
experimental f CRIT values ( f values at the caldera-collapse onset). A discontinuous line shows the
log-¢t to experimental values.Values of f CRIT for natural examples are calculated considering
di¡erent percentages (100--60%) of erupted magma (see Geyer et al., 2006 for details). Horizontal
lines in triangles ( f CRIT values considering that the magma chamber is completely emptied) are
the error bars due to the roof aspect ratio uncertainty.The vertical line marks the transition from
subcritical to supercritical collapses (modi¢ed after Geyer et al., 2006).
During the deflation process, a water-filled balloon creates surface deformation
in two different ways. First, filled to its maximum capacity it deflates elastically and
contracts due to overpressure decrease (see figures in Lavalle ´e et al., 2004 for more
details). Second, by contrast, at lower water capacities, the roof subsides vertically as
the water is evacuated. Lavalle ´e et al. (2004) proposed that these two mechanisms
of analogue chamber deformation represent initially elastic behaviour of the crust
and the crystal mush around the chamber during contraction as the pressure in
the magma chamber decreases, followed by brittle failure of the roof when the
deviatoric stress reaches the Mohr–Coulomb criterion curve.
The elastic walls of the balloon generate forces that do not have a counterpart in
natural systems and, in consequence, violate the principles of scaling. Lavalle ´e et al.
(2004) argued that the elastic walls can be interpreted as the boundary between
the water and the sand and may represent the crystal–mush transition between
the magma and the rock. However, the same authors admit that this boundary is
not scaled and prevents physical processes such as intrusion and the collapse of
blocks into the analogue magma chamber. In nature, such processes may affect the
magmatic pressure and could play a vital role during the process of caldera
formation.
Finally, some authors (e.g. Martı ´ et al., 1994; Walter and Troll, 2001; Geyer
et al., 2006) bury the balloon close to one of the walls of the experimental tank.
This layout is useful to observe the temporal evolution of the collapse but may alter
the structures developed during the collapse process. Martı ´ et al. (1994) evaluated