
Page 280 - Caldera Volcanism Analysis, Modelling and Response
P. 280
A Review on Collapse Caldera Modelling 255
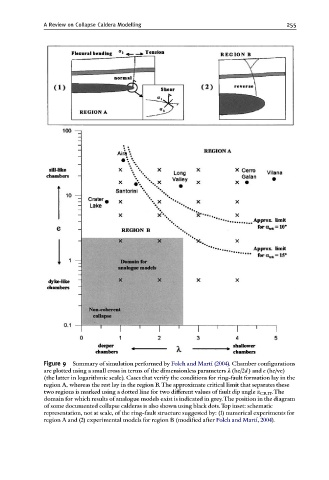
Figure 9 Summary of simulation performed by Folch and Mart|¤ (2004). Chamber con¢gurations
are plotted using a small cross in terms of the dimensionless parameters k (he/2d)and e (he/ve)
(the latter in logarithmic scale). Cases that verify the conditions for ring-fault formation lay in the
region A, whereas the rest lay in the region B.The approximate critical limit that separates these
two regions is marked using a dotted line for two di¡erent values of fault dip angle a CRIT .The
domain for which results of analogue models exist is indicated in grey.The position in the diagram
of some documented collapse calderas is also shown using black dots.Top inset: schematic
representation, not at scale, of the ring-fault structure suggested by: (1) numerical experiments for
region A and (2) experimental models for region B (modi¢ed after Folch and Mart|¤, 2004).