
Page 86 - Caldera Volcanism Analysis, Modelling and Response
P. 86
Pyroclastic Density Currents 61
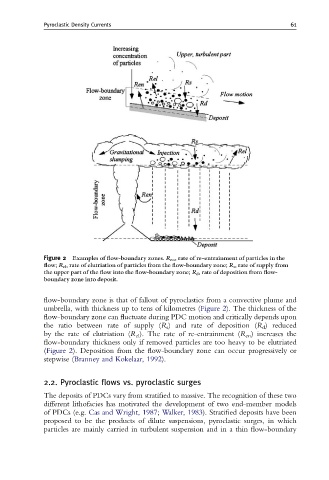
Figure 2 Examples of £ow-boundary zones. R en ,rate ofre-entrainment ofparticles in the
£ow; R el , rate of elutriation of particles from the £ow-boundary zone; R s , rate of supply from
the upper part of the £ow into the £ow-boundary zone; R d , rate of deposition from £ow-
boundary zone into deposit.
flow-boundary zone is that of fallout of pyroclastics from a convective plume and
umbrella, with thickness up to tens of kilometres (Figure 2). The thickness of the
flow-boundary zone can fluctuate during PDC motion and critically depends upon
the ratio between rate of supply (R s ) and rate of deposition (R d ) reduced
by the rate of elutriation (R el ). The rate of re-entrainment (R en ) increases the
flow-boundary thickness only if removed particles are too heavy to be elutriated
(Figure 2). Deposition from the flow-boundary zone can occur progressively or
stepwise (Branney and Kokelaar, 1992).
2.2. Pyroclastic flows vs. pyroclastic surges
The deposits of PDCs vary from stratified to massive. The recognition of these two
different lithofacies has motivated the development of two end-member models
of PDCs (e.g. Cas and Wright, 1987; Walker, 1983). Stratified deposits have been
proposed to be the products of dilute suspensions, pyroclastic surges, in which
particles are mainly carried in turbulent suspension and in a thin flow-boundary