
Page 90 - Carbon Nanotube Fibres and Yarns
P. 90
Carbon nanotube-reinforced polymer nanocomposite fibers 83
16 B
A1
14 (a)
12 (c) Polymer CNT/polymer
(e)
10
Shrinkage (%) 8 6 (d) L 0
(b)
4
Amorphous crystalline Interphase
2
>T g Heat ∆ >T g
∆
0
Heat
Polymer
20 40 60 80 100 120 140 160 180 200 CNT/polymer
(A) Temperature (°C) ∆L 2 < ∆L 1
∆L 1
16
A2 Control PAN
PAN/VGCNFs
14 PAN/MWNTs
PAN/SWNTs Heat ∆ >T m Heat ∆ >T m
Shrinkage (%) 12 Polymer ∆L′ 1 CNT/polymer ∆L′ 2 < ∆L′ 1
10
8
6
0 2 4 6 8 10 12 14 16 18
(B) CNT surface area (m 2 /g)
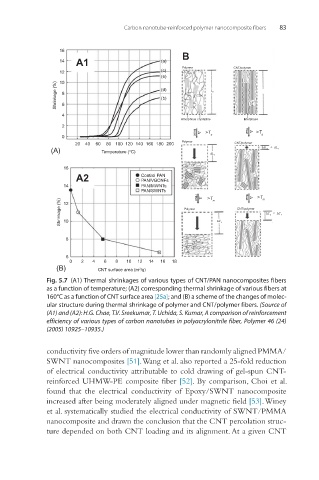
Fig. 5.7 (A1) Thermal shrinkages of various types of CNT/PAN nanocomposites fibers
as a function of temperature; (A2) corresponding thermal shrinkage of various fibers at
160°C as a function of CNT surface area [25a]; and (B) a scheme of the changes of molec-
ular structure during thermal shrinkage of polymer and CNT/polymer fibers. (Source of
(A1) and (A2): H.G. Chae, T.V. Sreekumar, T. Uchida, S. Kumar, A comparison of reinforcement
efficiency of various types of carbon nanotubes in polyacrylonitrile fiber, Polymer 46 (24)
(2005) 10925–10935.)
conductivity five orders of magnitude lower than randomly aligned PMMA/
SWNT nanocomposites [51]. Wang et al. also reported a 25-fold reduction
of electrical conductivity attributable to cold drawing of gel-spun CNT-
reinforced UHMW-PE composite fiber [52]. By comparison, Choi et al.
found that the electrical conductivity of Epoxy/SWNT nanocomposite
increased after being moderately aligned under magnetic field [53]. Winey
et al. systematically studied the electrical conductivity of SWNT/PMMA
nanocomposite and drawn the conclusion that the CNT percolation struc-
ture depended on both CNT loading and its alignment. At a given CNT