
Page 28 - Carbonate Facies in Geologic History
P. 28
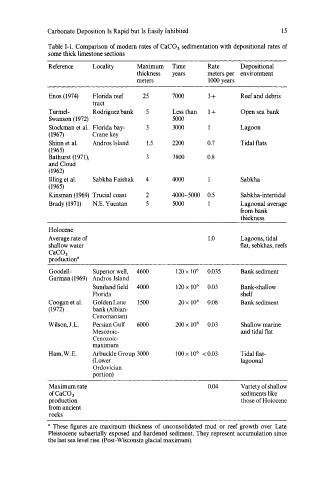
Carbonate Deposition Is Rapid but Is Easily Inhibited              15

               Table 1-1. Comparison of modern rates of CaC0 3  sedimentation with depositional rates  of
               some thick limestone sections
               Reference    Locality    Maximum  Time        Rate     Depositional
                                        thickness   years    meters per  environment
                                        meters               1000 years

               Enos (1974)   Florida reef   25     7000      3+       Reef and debris
                            tract
               Turmel-      Rodriguez bank   5     Less than   1+     Open sea bank
               Swanson (1972)                      5000
               Stockman et al.  Florida bay-  3    3000               Lagoon
               (1967)       Crane key
               Shinn et al.   Andros Island   1.5   2200     0.7      Tidal flats
               (1965)
               Bathurst (1971),            3       3800      0.8
               and Cloud
               (1962)
               Hling et al.   Sabkha Faishak   4   4000      1        Sabkha
               (1965)
               Kinsman (1969)  Trucial coast   2   4000-5000  0.5     Sabkha-intertidal
               Brady (1971)   N.E. Yucatan   5     5000      1        Lagoonal average
                                                                      from bank
                                                                      thickness

               Holocene
               Average rate of                               1.0      Lagoons, tidal
               shallow water                                          flat, sebkhas, reefs
               CaC0 3
               production·
               Goodell-     Superior well,   4600   120 x 10 6   0.035   Bank sediment
               Garman (1969)  Andros Island
                            Suniland field   4000   120 x 10 6   0.03   Bank-shallow
                            Florida                                   shelf
               Coogan et al.   Golden Lane   1500   20x 10 6   0.08   Bank sediment
               (1972)       bank (Albian-
                            Cenomanian)
               Wilson,J.L.   Persian Gulf   6000    200 x 10 6   0.03   Shallow marine
                            Mesozoic-                                 and tidal flat
                            Cenozoic-
                            maximum
               Ham,W.E.     Arbuckle Group 3000     100 x 10 6  < 0.03   Tidal flat-
                            (Lower                                    lagoonal
                            Ordovician
                            portion)
               Maximum rate                                  0.04     Variety of shallow
               ofCaC0 3                                                sediments like
               production                                              those of Holocene
               from ancient
               rocks
               a  These  figures  are maximum thickness  of unconsolidated  mud  or  reef growth  over  Late
               Pleistocene subaerially exposed and hardened sediment. They represent accumulation since
               the last sea level rise. (Post-Wisconsin glacial maximum).