
Page 81 - Carbonate Platforms Facies, Sequences, and Evolution
P. 81
the
cold
tions
shales
(1972)
ductivity
in
Weedon,
dry
inhibiting
similarities
Lower
an
to
(e.g.
separated
Lias
Amongst these
considered
extremes
Fig.
carbonate
by
of
temperature-controlled
temperature (Fig. 20d).
that
beds
20b),
off-platform
the
Dorset
through
of
simulations,
inhibiting
limestone-shale
changes
clastic
they are almost impossible to correlate.
in
(e.g.
there
sediment
mudstone.
alternations
environment
carbonate
sequences
House,
carbonate
influx
such
such
to model quite different responses to forcing func
oscillations between anoxia and turbulence or per
1986; Hallam 1986). This succession con
pro
variations resulting from climatic changes in source
variations in clastic influx; Weedon (1986) and House
1985;
hinterlands (Fig. 20c), or more complex switching
(1985) thought that climatic change was responsible
represent
Sellwood
through
as
are superficial
mechanisms such as depth- or circulation-determined
influx-controlled
as
haps the combined effect of warm humid extremes
sists of <1m scale thrn limestones and bituminous
and
over
muds
The
quences
will
thresholds
is
frequencies
and Hallam
Schwarzacher
be.
in
the
&
could
depend upon the
Cyclic sedimentation: simulation programs
be
Fisher
presence
operation.
When more
of
different
significant characteristic
(1982)
than
Hallam, 1986) may be unreliable.
power spectral analysis (Weedon,
across
a known chronological interval
drew
recurrent
a
1986,
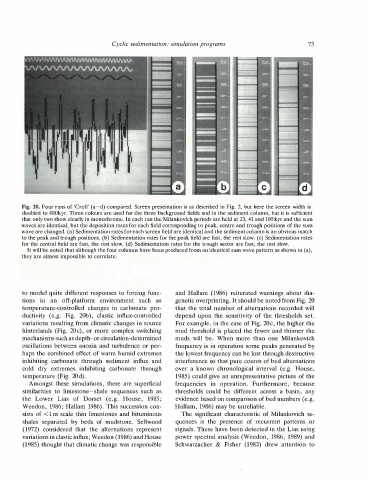
for the central field are fast, the rest slow. (d) Sedimentation rates for the trough sector are fast, the rest slow.
Furthermore,
(e.g.
basin,
patterns
attention
Fig. 20. Four runs of 'Croll' (a-d) compared. Screen presentation is as described in Fig. 2, but here the screen width is
It will be noted that although the four columns have been produced from an identical sum wave pattern as shown in (a),
doubled to 480kyr. Three colours are used for the three background fields and in the sediment column, but it is sufficient
wave are changed. (a) Sedimentation rates for each screen field are identical and the sediment column is an obvious match
to the peak and trough positions. (b) Sedimentation rates for the peak field are fast, the rest slow. (c) Sedimentation rates
that only two show clearly in monochrome. In each run the Milankovich periods are held at 23, 41 and 100 kyr and the sum
of Milankovich se
(1986) reiterated warnings about dia
waves are identical, but the deposition rates for each field corresponding to peak, centre and trough positions of the sum
the lowest frequency can be lost through destructive
sensitivity of the thresholds set.
House,
interference so that pure counts of bed alternations
73
For example, in the case of Fig. 20c, the higher the
frequency is in operation some peaks generated by
one Milankovich
signals. These have been detected in the Lias using
that the total number of alternations recorded will
evidence based on comparison of bed numbers (e.g.
any
1985) could give an unrepresentative picture of the
because
mud threshold is placed the fewer and thinner the
to
1989) and
or
genetic overprinting. It should be noted from Fig. 20