Page 144 - Carbonate Sedimentology and Sequence Stratigraphy
P. 144

CHAPTER 7: SEQUENCE STRATIGRAPHY OF THE T FACTORY                               135


                                                                                                      Site
                                                                                                      1005
                                                                                                 Site  0.2
                      400                                                                        1004
                                                                                                       0.41
                                                                                                  0.25
                                                                                                  0.41
                                                                                                       0.85
                                                                                                  0.85
                                                                                                       1.2
                                                                                            Site       1.44
                                                                                                       1.72
                                                                                            1003  1.44
                                                                                                       3.1
                      600                                                Site                0.25  1.72  3.6
                          Site
                                                                         1007
                          1006                                                               0.41      4.2
                           0.2                                            1.2                0.85
                           0.41                                          1.44                1.2
                                                                         1.72
                           0.85                                           2.0                1.72
                           1.2                                            2.4                2.0
                           1.44                                                              2.4
                                                                                             3.1
                           1.72                                                              3.6       6.8
                           2.0                                                                         7.7
                           2.4                                                               4.2       8.1
                      800                                                                              8.6
                           3.1
                           3.6
                                                                          3.1
                                                                          3.6                          9.4
                                                                          4.2
                           4.2
                                                                                             6.8
                                                                          4.7                          10.7
                                                                          6.5                7.7       11.3
                                                                          6.8                8.1       11.4
                                                                                             8.6
                                                                          7.7
                           4.7                                            8.1
                     1000                                                 8.6
                                                                                                       11.8
                                                                                                       11.9
                           5.6                                                               9.4
                           6.5                                            9.4
                           6.8
                                                                                             10.7
                                                                         10.7
                           7.7                                            11.4               11.3
                                                                                             11.4
                           8.1                                            11.3
                           8.6
                                                                          11.8
                     1200  9.4                                           11.9                11.8
                                                                                             11.9
                           10.7
                           11.4
                           11.3
                           11.8
                           11.9
                           13.2
                           13.2
                                                                         13.2                13.2
                     1400
                                                                         13.2
                                                                         13.6
                                                                                             13.6
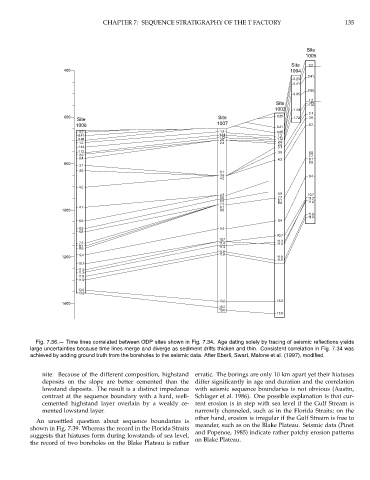
             Fig. 7.36.— Time lines correlated between ODP sites shown in Fig. 7.34. Age dating solely by tracing of seismic reflections yields
           large uncertainties because time lines merge and diverge as sediment drifts thicken and thin. Consistent correlation in Fig. 7.34 was
           achieved by adding ground truth from the boreholes to the seismic data. After Eberli, Swart, Malone et al. (1997), modified.
               nite. Because of the different composition, highstand  erratic. The borings are only 10 km apart yet their hiatuses
               deposits on the slope are better cemented than the differ significantly in age and duration and the correlation
               lowstand deposits. The result is a distinct impedance with seismic sequence boundaries is not obvious (Austin,
               contrast at the sequence boundary with a hard, well-  Schlager et al. 1986). One possible explanation is that cur-
               cemented highstand layer overlain by a weakly ce- rent erosion is in step with sea level if the Gulf Stream is
               mented lowstand layer.                             narrowly channeled, such as in the Florida Straits; on the
                                                                  other hand, erosion is irregular if the Gulf Stream is free to
             An unsettled question about sequence boundaries is
           shown in Fig. 7.39. Whereas the record in the Florida Straits  meander, such as on the Blake Plateau. Seismic data (Pinet
           suggests that hiatuses form during lowstands of sea level,  and Popenoe, 1985) indicate rather patchy erosion patterns
           the record of two boreholes on the Blake Plateau is rather  on Blake Plateau.
   139   140   141   142   143   144   145   146   147   148   149