
Page 36 - Carbonate Sedimentology and Sequence Stratigraphy
P. 36
CHAPTER 2: PRINCIPLES OF CARBONATE PRODUCTION 27
upper limit, Schlager (1999)
10 4
Sadler (1981)
10 2 0 1/9 2/9 1/3 2/3 7/9 8/9 1
micron / y T
N=379
10 0
10 4 3/4
C
N=92 (+T)
1/2
10 2
1/4
10 0
10 4
M
N=47 (+T)
1/9 2/9 1/3 2/3 7/9 8/9
10 2
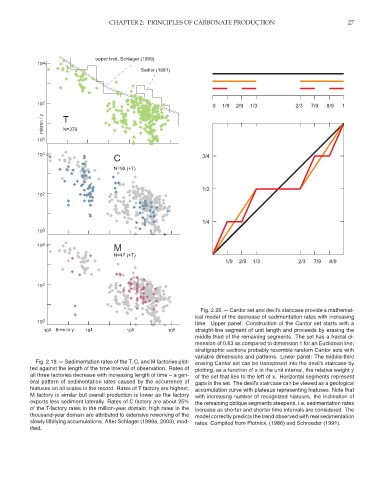
Fig. 2.20.— Cantor set and devil’s staircase provide a mathemat-
ical model of the decrease of sedimentation rates with increasing
10 0 time. Upper panel: Construction of the Cantor set starts with a
10 2 time in y 10 4 10 6 10 8 straight-line segment of unit length and proceeds by erasing the
middle third of the remaining segments. The set has a fractal di-
mension of 0.63 as compared to dimension 1 for an Euclidean line;
stratigraphic sections probably resemble random Cantor sets with
variable dimensions and patterns. Lower panel: The middle-third
Fig. 2.19.— Sedimentation rates of the T, C, and M factories plot- erasing Cantor set can be transposed into the devil’s staircase by
ted against the length of the time interval of observation. Rates of plotting, as a function of x in the unit interval, the relative weight y
all three factories decrease with increasing length of time – a gen- of the set that lies to the left of x. Horizontal segments represent
eral pattern of sedimentation rates caused by the occurrence of gaps in the set. The devil’s staircase can be viewed as a geological
hiatuses on all scales in the record. Rates of T factory are highest, accumulation curve with plateaus representing hiatuses. Note that
M factory is similar but overall production is lower as the factory with increasing number of recognized hiatuses, the inclination of
exports less sediment laterally. Rates of C factory are about 25% the remaining oblique segments steepens, i.e. sedimentation rates
of the T-factory rates in the million-year domain; high rates in the increase as shorter and shorter time intervals are considered. The
thousand-year domain are attributed to extensive reworking of the model correctly predicts the trend observed with real sedimentation
slowly lithifying accumulations. After Schlager (1999a, 2003), mod- rates. Compiled from Plotnick, (1986) and Schroeder (1991).
ified.