
Page 262 - Challenges in Corrosion Costs Causes Consequences and Control(2015)
P. 262
240 CORROSION CONTROL AND PREVENTION
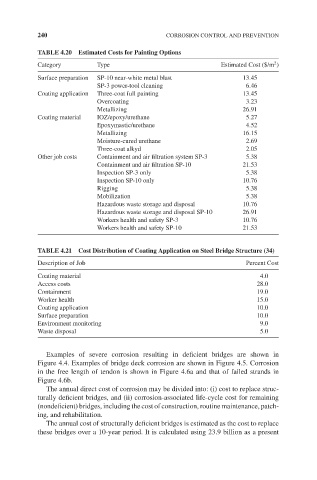
TABLE 4.20 Estimated Costs for Painting Options
2
Category Type Estimated Cost ($/m )
Surface preparation SP-10 near-white metal blast 13.45
SP-3 power-tool cleaning 6.46
Coating application Three-coat full painting 13.45
Overcoating 3.23
Metallizing 26.91
Coating material IOZ/epoxy/urethane 5.27
Epoxymastic/urethane 4.52
Metallizing 16.15
Moisture-cured urethane 2.69
Three-coat alkyd 2.05
Other job costs Containment and air filtration system SP-3 5.38
Containment and air filtration SP-10 21.53
Inspection SP-3 only 5.38
Inspection SP-10 only 10.76
Rigging 5.38
Mobilization 5.38
Hazardous waste storage and disposal 10.76
Hazardous waste storage and disposal SP-10 26.91
Workers health and safety SP-3 10.76
Workers health and safety SP-10 21.53
TABLE 4.21 Cost Distribution of Coating Application on Steel Bridge Structure (34)
Description of Job Percent Cost
Coating material 4.0
Access costs 28.0
Containment 19.0
Worker health 15.0
Coating application 10.0
Surface preparation 10.0
Environment monitoring 9.0
Waste disposal 5.0
Examples of severe corrosion resulting in deficient bridges are shown in
Figure 4.4. Examples of bridge deck corrosion are shown in Figure 4.5. Corrosion
in the free length of tendon is shown in Figure 4.6a and that of failed strands in
Figure 4.6b.
The annual direct cost of corrosion may be divided into: (i) cost to replace struc-
turally deficient bridges, and (ii) corrosion-associated life-cycle cost for remaining
(nondeficient) bridges, including the cost of construction, routine maintenance, patch-
ing, and rehabilitation.
The annual cost of structurally deficient bridges is estimated as the cost to replace
these bridges over a 10-year period. It is calculated using 23.9 billion as a present