
Page 267 - Chemical Process Equipment - Selection and Design
P. 267
234 DRYERS AND COOLING TOWERS
-
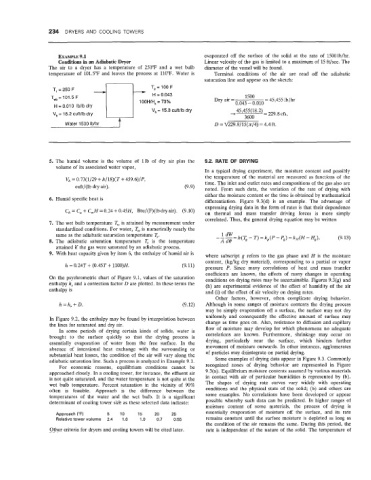
T, = 250 F T2=100F
=
H
T*= 101.5 F - 0.043 = 45,455 lb/hr
l5Oo
1 OOHIH, = 73% Dry air = 0.043 - 0.010
H = 0.01 0 Ib/lb dry
V, = 15.3 CWlb dry
V, = 18.2 CWlb dry -+ 45945w3.2) = 229.8 cfs,
3600
5. The humid volume is the volume of llb of dry air plus the 9.2. RATE OF DRYING
volume of its associated water vapor,
In a typical drying experiment, the moisture content and possibly
V, = 0.73(1/29 + h/18)(T + 459.6)/P, the temperature of the material are measured as functions of the
time. The inlet and outlet rates and compositions of the gas also are
cuft/(lb dry air). (9.9) noted. From such data, the variation of the rate of drying with
either the moisture content or the time is obtained by mathematical
6. Humid specific heat is differentiation. Figure 9.3(d) is an example. The advantage of
expressing drying data in the form of rates is that their dependence
C, = C, + C,H = 0.24 + 0.45H, Btu/(F)(lbdryair). (9.10) on thermal and mass transfer driving forces is more simply
correlated. Thus, the general drying equation may be written
7. The wet bulb temperature T, is attained by measurement under
standardized conditions. For water, T,, is numerically nearly the
same as the adiabatic saturation temperature T,. ---= dW h(T,- T)=k,(P-P,)=k,(H-H,), (9.13)
8. The adiabatic saturation temperature T, is the temperature A de
attained if the gas were saturated by an adiabatic process.
9. With heat capacity given by item 6, the enthalpy of humid air is where subscript g refers to the gas phase and H is the moisture
content, (kg/kg dry material), corresponding to a partial or vapor
h = 0.24T + (0.45T + 11OO)H. (9.11) pressure P. Since many correlations of heat and mass transfer
coefficients are known, the effects of many changes in operating
On the psychrometric chart of Figure 9.1, values of the saturation conditions on drying rates may be ascertainable. Figures 9.3(g) and
enthalpy h, and a correction factor D are plotted. In these terms the (h) are experimental evidence of the effect of humidity of the air
enthalpy is and (i) of the effect of air velocity on drying rates.
Other factors, however, often complicate drying behavior.
h = h, + D. (9.12) Although in some ranges of moisture contents the drying process
may be simply evaporation off a surface, the surface may not dry
uniformly and consequently the effective amount of surface may
In Figure 9.2, the enthalpy may be found by interpolation between
the lines for saturated and dry air. change as time goes on. Also, resistance to diffusion and capillary
In some periods of drying certain kinds of solids, water is flow of moisture may develop for which phenomena no adequate
brought to the surface quickly so that the drying process is correlations are known. Furthermore, shrinkage may occur on
drying, particularly near the surface, which hinders further
essentially evaporation of water from the free surface. In the
absence of intentional heat exchange with the surrounding or movement of moisture outwards. In other instances, agglomerates
substantial heat losses, the condition of the air will vary along the of particles may disintegrate on partial drying.
adiabatic saturation line. Such a process is analyzed in Example 9.1. Some examples of drying data appear in Figure 9.3. Commonly
For economic reasons, equilibrium conditions cannot be recognized zones of drying behavior are represented in Figure
approached closely. In a cooling tower, for instance, the effluent air 9.3(a). Equilibrium moisture contents assumed by various materials
is not quite saturated, and the water temperature is not quite at the in contact with air of particular humidities is represented by (b).
wet bulb temperature. Percent saturation in the vicinity of 90% The shapes of drying rate curves vary widely with operating
often is feasible. Approach is the difference between the conditions and the physical state of the solid; (b) and others are
temperatures of the water and the wet bulb. It is a significant some examples. No correlations have been developed or appear
determinant of cooling tower sizk as these selected data indicate: possible whereby such data can be predicted. In higher ranges of
moisture content of some materials, the process of drying is
Approach ("F) 5 10 15 20 25 essentially evaporation of moisture off the surface, and its rate
Relativetowervolume 2.4 1.6 1.0 0.7 0.55 remains constant until the surface moisture is depleted as long as
the condition of the air remains the same. During this period, the
Other criteria for dryers and cooling towers will be cited later. rate is independent of the nature of the solid. The temperature of