Page 375 - Civil Engineering Formulas
P. 375

304                   CHAPTER TWELVE

             For pipes flowing full:
                                           S
                               V   0.55C 1 D 0.63 0.54         (12.29)
                                            S
                               Q   0.432C 1 D 2.63 0.54        (12.30)
                                   4.727   Q  1.85
                                        L
                               h f    4.87                     (12.31)
                                    D      C 1
                                   1.376  Q  0.38
                               D    0.205                      (12.32)
                                    S     C 1
           where V   velocity, ft/s (m/s)
                C   coefficient, dependent on surface roughness (given in engineering
                 1
                    handbooks)
                R   hydraulic radius, ft (m)
                 S   head loss due to friction, ft/ft (m/m) of pipe
                D   diameter of pipe, ft (m)
                L   length of pipe, ft (m)
                             3
                                 3
                Q   discharge, ft /s (m /s)
                h   friction loss, ft (m)
                 f
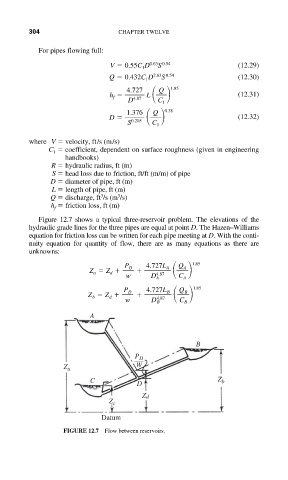
             Figure 12.7 shows a typical three-reservoir problem. The elevations of the
           hydraulic grade lines for the three pipes are equal at point D. The Hazen–Williams
           equation for friction loss can be written for each pipe meeting at D. With the conti-
           nuity equation for quantity of flow, there are as many equations as there are
           unknowns:
                                           4.87
                          Z a   Z d    P D     4.727L A  Q A  1.85
                                   w     D A    C A
                                           4.87
                                   P D  4.727L B  Q B  1.85
                          Z b   Z d
                                   w     D B    C B
                          A


                                                     B
                                     P D
                   Z a                W

                          C                               Z b
                                      D
                                       Zd
                               Z c
                             Datum
                   FIGURE 12.7  Flow between reservoirs.
   370   371   372   373   374   375   376   377   378   379   380