
Page 20 - Compression Machinery for Oil and Gas
P. 20
Oil and Gas Compressor Basics Chapter 1 9
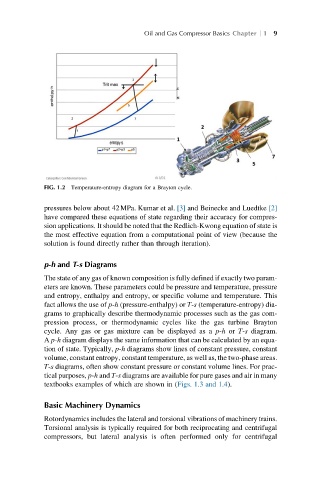
FIG. 1.2 Temperature-entropy diagram for a Brayton cycle.
pressures below about 42MPa. Kumar et al. [3] and Beinecke and Luedtke [2]
have compared these equations of state regarding their accuracy for compres-
sion applications. It should be noted that the Redlich-Kwong equation of state is
the most effective equation from a computational point of view (because the
solution is found directly rather than through iteration).
p-h and T-s Diagrams
The state of any gas of known composition is fully defined if exactly two param-
eters are known. These parameters could be pressure and temperature, pressure
and entropy, enthalpy and entropy, or specific volume and temperature. This
fact allows the use of p-h (pressure-enthalpy) or T-s (temperature-entropy) dia-
grams to graphically describe thermodynamic processes such as the gas com-
pression process, or thermodynamic cycles like the gas turbine Brayton
cycle. Any gas or gas mixture can be displayed as a p-h or T-s diagram.
A p-h diagram displays the same information that can be calculated by an equa-
tion of state. Typically, p-h diagrams show lines of constant pressure, constant
volume, constant entropy, constant temperature, as well as, the two-phase areas.
T-s diagrams, often show constant pressure or constant volume lines. For prac-
tical purposes, p-h and T-s diagrams are available for pure gases and air in many
textbooks examples of which are shown in (Figs. 1.3 and 1.4).
Basic Machinery Dynamics
Rotordynamics includes the lateral and torsional vibrations of machinery trains.
Torsional analysis is typically required for both reciprocating and centrifugal
compressors, but lateral analysis is often performed only for centrifugal