
Page 189 - Computational Retinal Image Analysis
P. 189
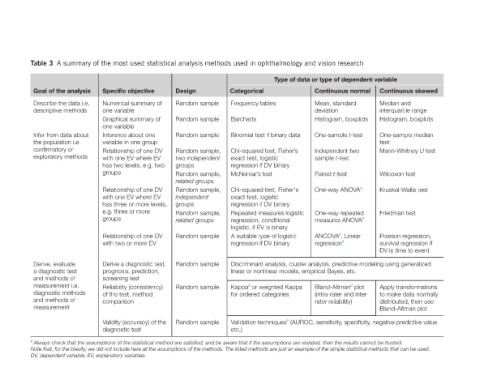
Continuous skewed  Median and   interquartile range  Histogram, boxplots  One-sample median   test  Mann-Whitney U test  Wilcoxon test  Kruskal-Wallis test  Friedman test  Poisson regression,   survival regression if   DV is time to event  Apply transformations   to make data normally   distributed, then use   Bland-Altman plot


                        Type of data or type of dependent variable  Continuous normal  Mean, standard   deviation  Histogram, boxplots  One-sample t-test  Independent two   sample t-test  Paired t-test  One-way ANOVA a  One-way repeated   measures ANOVA a  ANCOVA a , Linear   regression a Discriminant analysis, cluster analysis, predictive modeling using generalized  linear or nonlinear models, empirical Bayes, etc.  Bland-Altma


                   Table 3  A summary of the most used statistical analysis methods used in ophthalmology and vision research


                           Categorical  Frequency tables  Barcharts  Binomial test if binary data  Chi-squared test, Fisher’s   exact test, logistic   regression if DV binary  McNemar’s test  Chi-squared test, Fisher's   exact test, logistic   regression if DV binary Repeated measures logistic   regression, conditional   logistic, if EV is binary  A suitable type of logistic   regression if DV binary  Kappa a  or weighted Kappa


                              Random sample  Random sample  Random sample  Random sample,   two independent   Random sample,   related groups  Random sample,   independent   Random sample,   related groups  Random sample  Random sample  Random sample  Random sample a  Always check that the assumptions of the statistical method are satisfied; and be aware that if the assumptions are violated, then the results cannot be trusted.


                           Design              groups     groups


                           Specific objective  Numerical summary of   one variable  Graphical summary of   one variable  Inference about one   variable in one group  Relationship of one DV   with one EV where EV   has two levels, e.g. two   groups  Relationship of one DV   with one EV where EV  has three or more levels,   e.g. three or more   groups  Relationship of one DV   with two or more EV  Derive a diagnostic test,   progn


                           Goal of the analysis  Describe the data i.e.   descriptive methods  Infer from data about   the population i.e.   confirmatory or   exploratory methods  Derive, evaluate   a diagnostic test   and methods of   measurement i.e.   diagnostic methods   and methods of   measurement  DV, dependent variable; EV, explanatory variables.