
Page 95 - Convergent Journalism an Introduction Writing and Producing Across Media
P. 95
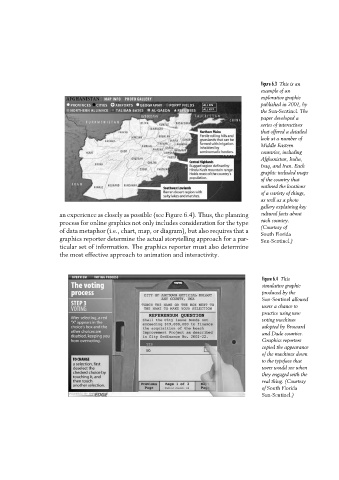
Figure 6.3 This is an
                                                                                            example of an
                                                                                            explorative graphic
                                                                                            published in 2001, by
                                                                                            the Sun-Sentinel. The
                                                                                            paper developed a
                                                                                            series of interactives
                                                                                            that offered a detailed
                                                                                            look at a number of
                                                                                            Middle Eastern
                                                                                            countries, including
                                                                                            Afghanistan, India,
                                                                                            Iraq, and Iran. Each
                                                                                            graphic included maps
                                                                                            of the country that
                                                                                            outlined the locations
                                                                                            of a variety of things,
                                                                                            as well as a photo
                                                                                            gallery explaining key
                      an experience as closely as possible (see Figure 6.4). Thus, the planning  cultural facts about
                      process for online graphics not only includes consideration for the type  each country.
                                                                                            (Courtesy of
                      of data metaphor (i.e., chart, map, or diagram), but also requires that a
                                                                                            South Florida
                      graphics reporter determine the actual storytelling approach for a par-  Sun-Sentinel.)
                      ticular set of information. The graphics reporter must also determine
                      the most effective approach to animation and interactivity.


                                                                                             Figure 6.4 This
                                                                                             simulative graphic
                                                                                             produced by the
                                                                                             Sun-Sentinel allowed
                                                                                             users a chance to
                                                                                             practice using new
                                                                                             voting machines
                                                                                             adopted by Broward
                                                                                             and Dade counties.
                                                                                             Graphics reporters
                                                                                             copied the appearance
                                                                                             of the machines down
                                                                                             to the typeface that
                                                                                             users would see when
                                                                                             they engaged with the
                                                                                             real thing. (Courtesy
                                                                                             of South Florida
                                                                                             Sun-Sentinel.)