
Page 688 - Corrosion Engineering Principles and Practice
P. 688
642 C h a p t e r 1 4 P r o t e c t i v e C o a t i n g s 643
25 µm
A
B C
D
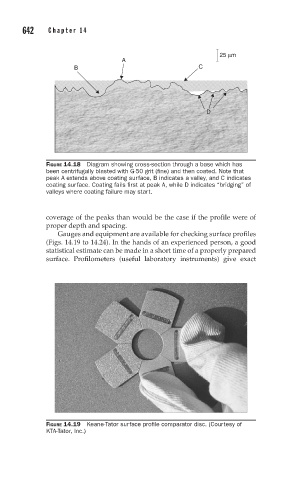
FIGURE 14.18 Diagram showing cross-section through a base which has
been centrifugally blasted with G-50 grit (fine) and then coated. Note that
peak A extends above coating surface, B indicates a valley, and C indicates
coating surface. Coating fails first at peak A, while D indicates “bridging” of
valleys where coating failure may start.
coverage of the peaks than would be the case if the profile were of
proper depth and spacing.
Gauges and equipment are available for checking surface profiles
(Figs. 14.19 to 14.24). In the hands of an experienced person, a good
statistical estimate can be made in a short time of a properly prepared
surface. Profilometers (useful laboratory instruments) give exact
FIGURE 14.19 Keane-Tator surface profile comparator disc. (Courtesy of
KTA-Tator, Inc.)