
Page 171 - Culture Technology Communication
P. 171
154 Lucienne Rey
being appreciated as forms of personal culture were those with
direct publicity, i.e., a specific public. Contacts within a large or
small circle were included. Popular, folkloric events held in
small, local premises or scenes of agricultural work were those
that better characterised the conception of culture in the Ger-
man-speaking area of Switzerland. (Meier-Dallach 1991, 14:
translation by the author, LR).
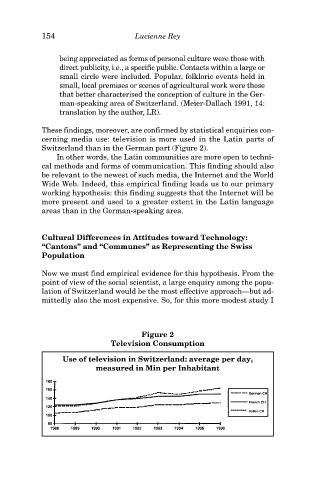
These findings, moreover, are confirmed by statistical enquiries con-
cerning media use: television is more used in the Latin parts of
Switzerland than in the German part (Figure 2).
In other words, the Latin communities are more open to techni-
cal methods and forms of communication. This finding should also
be relevant to the newest of such media, the Internet and the World
Wide Web. Indeed, this empirical finding leads us to our primary
working hypothesis: this finding suggests that the Internet will be
more present and used to a greater extent in the Latin language
areas than in the German-speaking area.
Cultural Differences in Attitudes toward Technology:
“Cantons” and “Communes” as Representing the Swiss
Population
Now we must find empirical evidence for this hypothesis. From the
point of view of the social scientist, a large enquiry among the popu-
lation of Switzerland would be the most effective approach—but ad-
mittedly also the most expensive. So, for this more modest study I
Figure 2
Television Consumption
Use of television in Switzerland: average per day,
measured in Min per Inhabitant