
Page 83 - Cultures and Organizations
P. 83
More Equal than Others 65
tion and therefore usually taken by lower- or “working”-class persons. 14
Altogether, thirty-eight different occupations within these three countries
could be compared.
The three questions used for calculating the PDI across countries were
also correlated across occupations; it was therefore possible to compute
occupational PDI values as well. 15
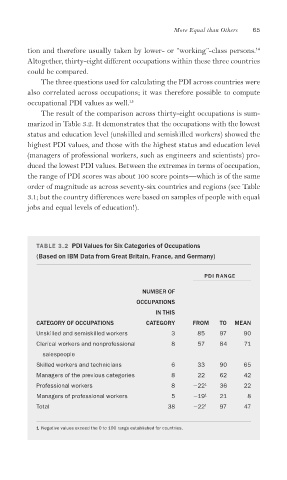
The result of the comparison across thirty-eight occupations is sum-
marized in Table 3.2. It demonstrates that the occupations with the lowest
status and education level (unskilled and semiskilled workers) showed the
highest PDI values, and those with the highest status and education level
(managers of professional workers, such as engineers and scientists) pro-
duced the lowest PDI values. Between the extremes in terms of occupation,
the range of PDI scores was about 100 score points—which is of the same
order of magnitude as across seventy-six countries and regions (see Table
3.1; but the country differences were based on samples of people with equal
jobs and equal levels of education!).
TABLE 3.2 PDI Values for Six Categories of Occupations
(Based on IBM Data from Great Britain, France, and Germany)
PDI RANGE
NUMBER OF
OCCUPATIONS
IN THIS
CATEGORY OF OCCUPATIONS CATEGORY FROM TO MEAN
Unskilled and semiskilled workers 3 85 97 90
Clerical workers and nonprofessional 8 57 84 71
salespeople
Skilled workers and technicians 6 33 90 65
Managers of the previous categories 8 22 62 42
Professional workers 8 22 1 36 22
Managers of professional workers 5 19 1 21 8
Total 38 22 1 97 47
1 Negative values exceed the 0 to 100 range established for countries.