
Page 54 - Data Architecture
P. 54
Chapter 1.4: Demographics of Corporate Data
In Fig. 1.4.1, it is seen that all data in big data are unstructured and that big data can be
divided up into two major categories—repetitive unstructured data and nonrepetitive
unstructured data. The diagram in Fig. 1.4.1 shows the major categorization of corporate
data. But the diagram can be very misleading. Some corporations have a tremendous
amount of repetitive unstructured data, and other corporations have no repetitive
unstructured data at all.
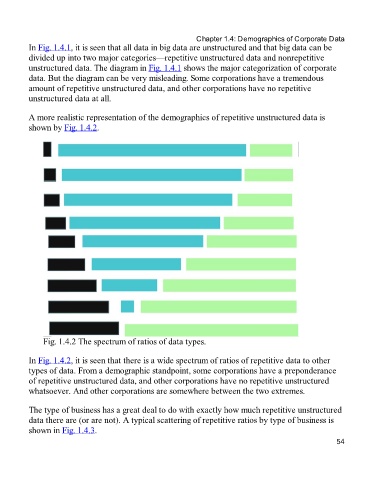
A more realistic representation of the demographics of repetitive unstructured data is
shown by Fig. 1.4.2.
Fig. 1.4.2 The spectrum of ratios of data types.
In Fig. 1.4.2, it is seen that there is a wide spectrum of ratios of repetitive data to other
types of data. From a demographic standpoint, some corporations have a preponderance
of repetitive unstructured data, and other corporations have no repetitive unstructured
whatsoever. And other corporations are somewhere between the two extremes.
The type of business has a great deal to do with exactly how much repetitive unstructured
data there are (or are not). A typical scattering of repetitive ratios by type of business is
shown in Fig. 1.4.3.
54