
Page 57 -
P. 57
HAN 08-ch01-001-038-9780123814791
20 Chapter 1 Introduction 2011/6/1 3:12 Page 20 #20
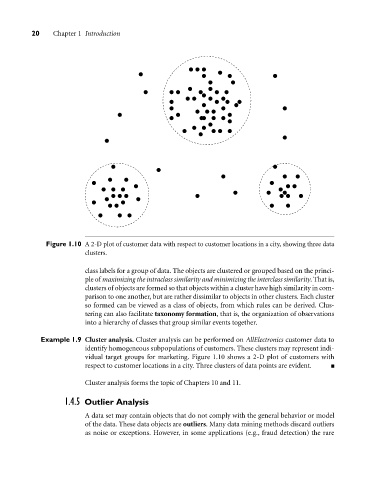
Figure 1.10 A 2-D plot of customer data with respect to customer locations in a city, showing three data
clusters.
class labels for a group of data. The objects are clustered or grouped based on the princi-
ple of maximizing the intraclass similarity and minimizing the interclass similarity. That is,
clusters of objects are formed so that objects within a cluster have high similarity in com-
parison to one another, but are rather dissimilar to objects in other clusters. Each cluster
so formed can be viewed as a class of objects, from which rules can be derived. Clus-
tering can also facilitate taxonomy formation, that is, the organization of observations
into a hierarchy of classes that group similar events together.
Example 1.9 Cluster analysis. Cluster analysis can be performed on AllElectronics customer data to
identify homogeneous subpopulations of customers. These clusters may represent indi-
vidual target groups for marketing. Figure 1.10 shows a 2-D plot of customers with
respect to customer locations in a city. Three clusters of data points are evident.
Cluster analysis forms the topic of Chapters 10 and 11.
1.4.5 Outlier Analysis
A data set may contain objects that do not comply with the general behavior or model
of the data. These data objects are outliers. Many data mining methods discard outliers
as noise or exceptions. However, in some applications (e.g., fraud detection) the rare